-
Notifications
You must be signed in to change notification settings - Fork 1
Expand file tree
/
Copy pathonspres2022.Rmd
More file actions
384 lines (227 loc) · 10.7 KB
/
onspres2022.Rmd
File metadata and controls
384 lines (227 loc) · 10.7 KB
1
2
3
4
5
6
7
8
9
10
11
12
13
14
15
16
17
18
19
20
21
22
23
24
25
26
27
28
29
30
31
32
33
34
35
36
37
38
39
40
41
42
43
44
45
46
47
48
49
50
51
52
53
54
55
56
57
58
59
60
61
62
63
64
65
66
67
68
69
70
71
72
73
74
75
76
77
78
79
80
81
82
83
84
85
86
87
88
89
90
91
92
93
94
95
96
97
98
99
100
101
102
103
104
105
106
107
108
109
110
111
112
113
114
115
116
117
118
119
120
121
122
123
124
125
126
127
128
129
130
131
132
133
134
135
136
137
138
139
140
141
142
143
144
145
146
147
148
149
150
151
152
153
154
155
156
157
158
159
160
161
162
163
164
165
166
167
168
169
170
171
172
173
174
175
176
177
178
179
180
181
182
183
184
185
186
187
188
189
190
191
192
193
194
195
196
197
198
199
200
201
202
203
204
205
206
207
208
209
210
211
212
213
214
215
216
217
218
219
220
221
222
223
224
225
226
227
228
229
230
231
232
233
234
235
236
237
238
239
240
241
242
243
244
245
246
247
248
249
250
251
252
253
254
255
256
257
258
259
260
261
262
263
264
265
266
267
268
269
270
271
272
273
274
275
276
277
278
279
280
281
282
283
284
285
286
287
288
289
290
291
292
293
294
295
296
297
298
299
300
301
302
303
304
305
306
307
308
309
310
311
312
313
314
315
316
317
318
319
320
321
322
323
324
325
326
327
328
329
330
331
332
333
334
335
336
337
338
339
340
341
342
343
344
345
346
347
348
349
350
351
352
353
354
355
356
357
358
359
360
361
362
363
364
365
366
367
368
369
370
371
372
373
374
375
376
377
378
379
380
381
382
---
title: "New Mobility Datasets"
subtitle: "ONS Expert Panel"
author: "Robin Lovelace, University of Leeds <br>[Data Science Fellow at N. 10](https://www.ukri.org/opportunity/esrc-adr-uk-no-10-data-science-fellowships-2021/)"
date: "2022-02-07"
output:
xaringan::moon_reader:
nature:
highlightStyle: github
highlightLines: true
countIncrementalSlides: false
---
```{r, include=FALSE}
library(tidyverse)
library(tmap)
tmap_mode("view")
knitr::opts_chunk$set(echo = FALSE)
```
## Bio
I'm an Associate Professor of **Transport Data Science** at the Leeds Institute for Transport Studies (ITS). I have experience not only of data science research but of developing new **methods**, **tools** and **software** to inform policy.
--
## Application
Becoming an ESRC-ADR UK No.10 Data Science Fellow will allow me to make the best use of my **expertise to support the needs of central government**, especially in relation to ... decarbonisation, active travel and the government's leveling-up agenda.
The government has set-out these priorities ...
the [*Decarbonising transport: setting the challenge*](https://www.gov.uk/government/publications/creating-the-transport-decarbonisation-plan) and the *Levelling Up plan*.
--
Translating the laudable objectives of these documents into deliverable plans requires an evidence-based approach, to achieve maximum impact and value for money **at the local level**, an area in which I have substantial experience.
---
# Background, collaborations, interests
- BSc in Geography (Bristol) and MSc in Environmental Science (York), PhD in energy costs of commuting [2014](http://etheses.whiterose.ac.uk/5027/)
- Limitations of available tools for modelling led to the development of new methodologies and the book Spatial Microsimulation with R ([2016](https://spatial-microsim-book.robinlovelace.net/))
- Co-authored Efficient R Programming ([2016](https://csgillespie.github.io/efficientR/))
- Lead Developer of Propensity to Cycle Tool (PCT) ([2017](https://www.jtlu.org/index.php/jtlu/article/view/862))
- Author of Geocomputation with R ([2019](http://geocompr.robinlovelace.net/transport.html))
- Substantial [research](https://www.robinlovelace.net/publication/) output ([h-index](https://scholar.google.com/citations?user=xDJHVCAAAAAJ&hl=en): 20)
--
```{r, out.width="30%", fig.show='hold', echo=FALSE}
knitr::include_graphics(c(
"https://docs.ropensci.org/stplanr/reference/figures/stplanr.png",
"https://raw.githubusercontent.com/ropensci/stats19/master/man/figures/logo.png",
"https://github.com/Robinlovelace/geocompr/blob/main/images/geocompr_hex.png?raw=true"
))
```
--
- Evidence-based policies in government: [Data Science Fellowship at N. 10](https://www.ukri.org/opportunity/esrc-adr-uk-no-10-data-science-fellowships-2021/)
???
- Turing Fellowship
- LIDA internship on open transport infrastructure data
- Links with DfT, MHCLG, TfNH, international partners
--
- Future areas of development: Reproducible Bayesian modelling of proportions (Dirichlet regression), Machine Learning, Decarbonisation Agenda
---
---
.left-column[
### Expertise: Geocomputation
Computationally efficient data science tools
Intuitive, future proof, scalable code
Geographic vector data analysis

Geographic raster data

]
--
.right-column[
```{r}
knitr::include_graphics("https://user-images.githubusercontent.com/1825120/142071229-81358e26-5e8d-437e-9ef8-91704a4e690f.png")
```
Source: Morgan and Lovelace (2020) https://doi.org/10.1177/2399808320942779
]
???
I am an all-round data scientist with experience with Python, Julia, and command line tools such as Docker and shell scripting for scalable data science applications.
I have particular expertise in R and geocomputation with R in particular.
---
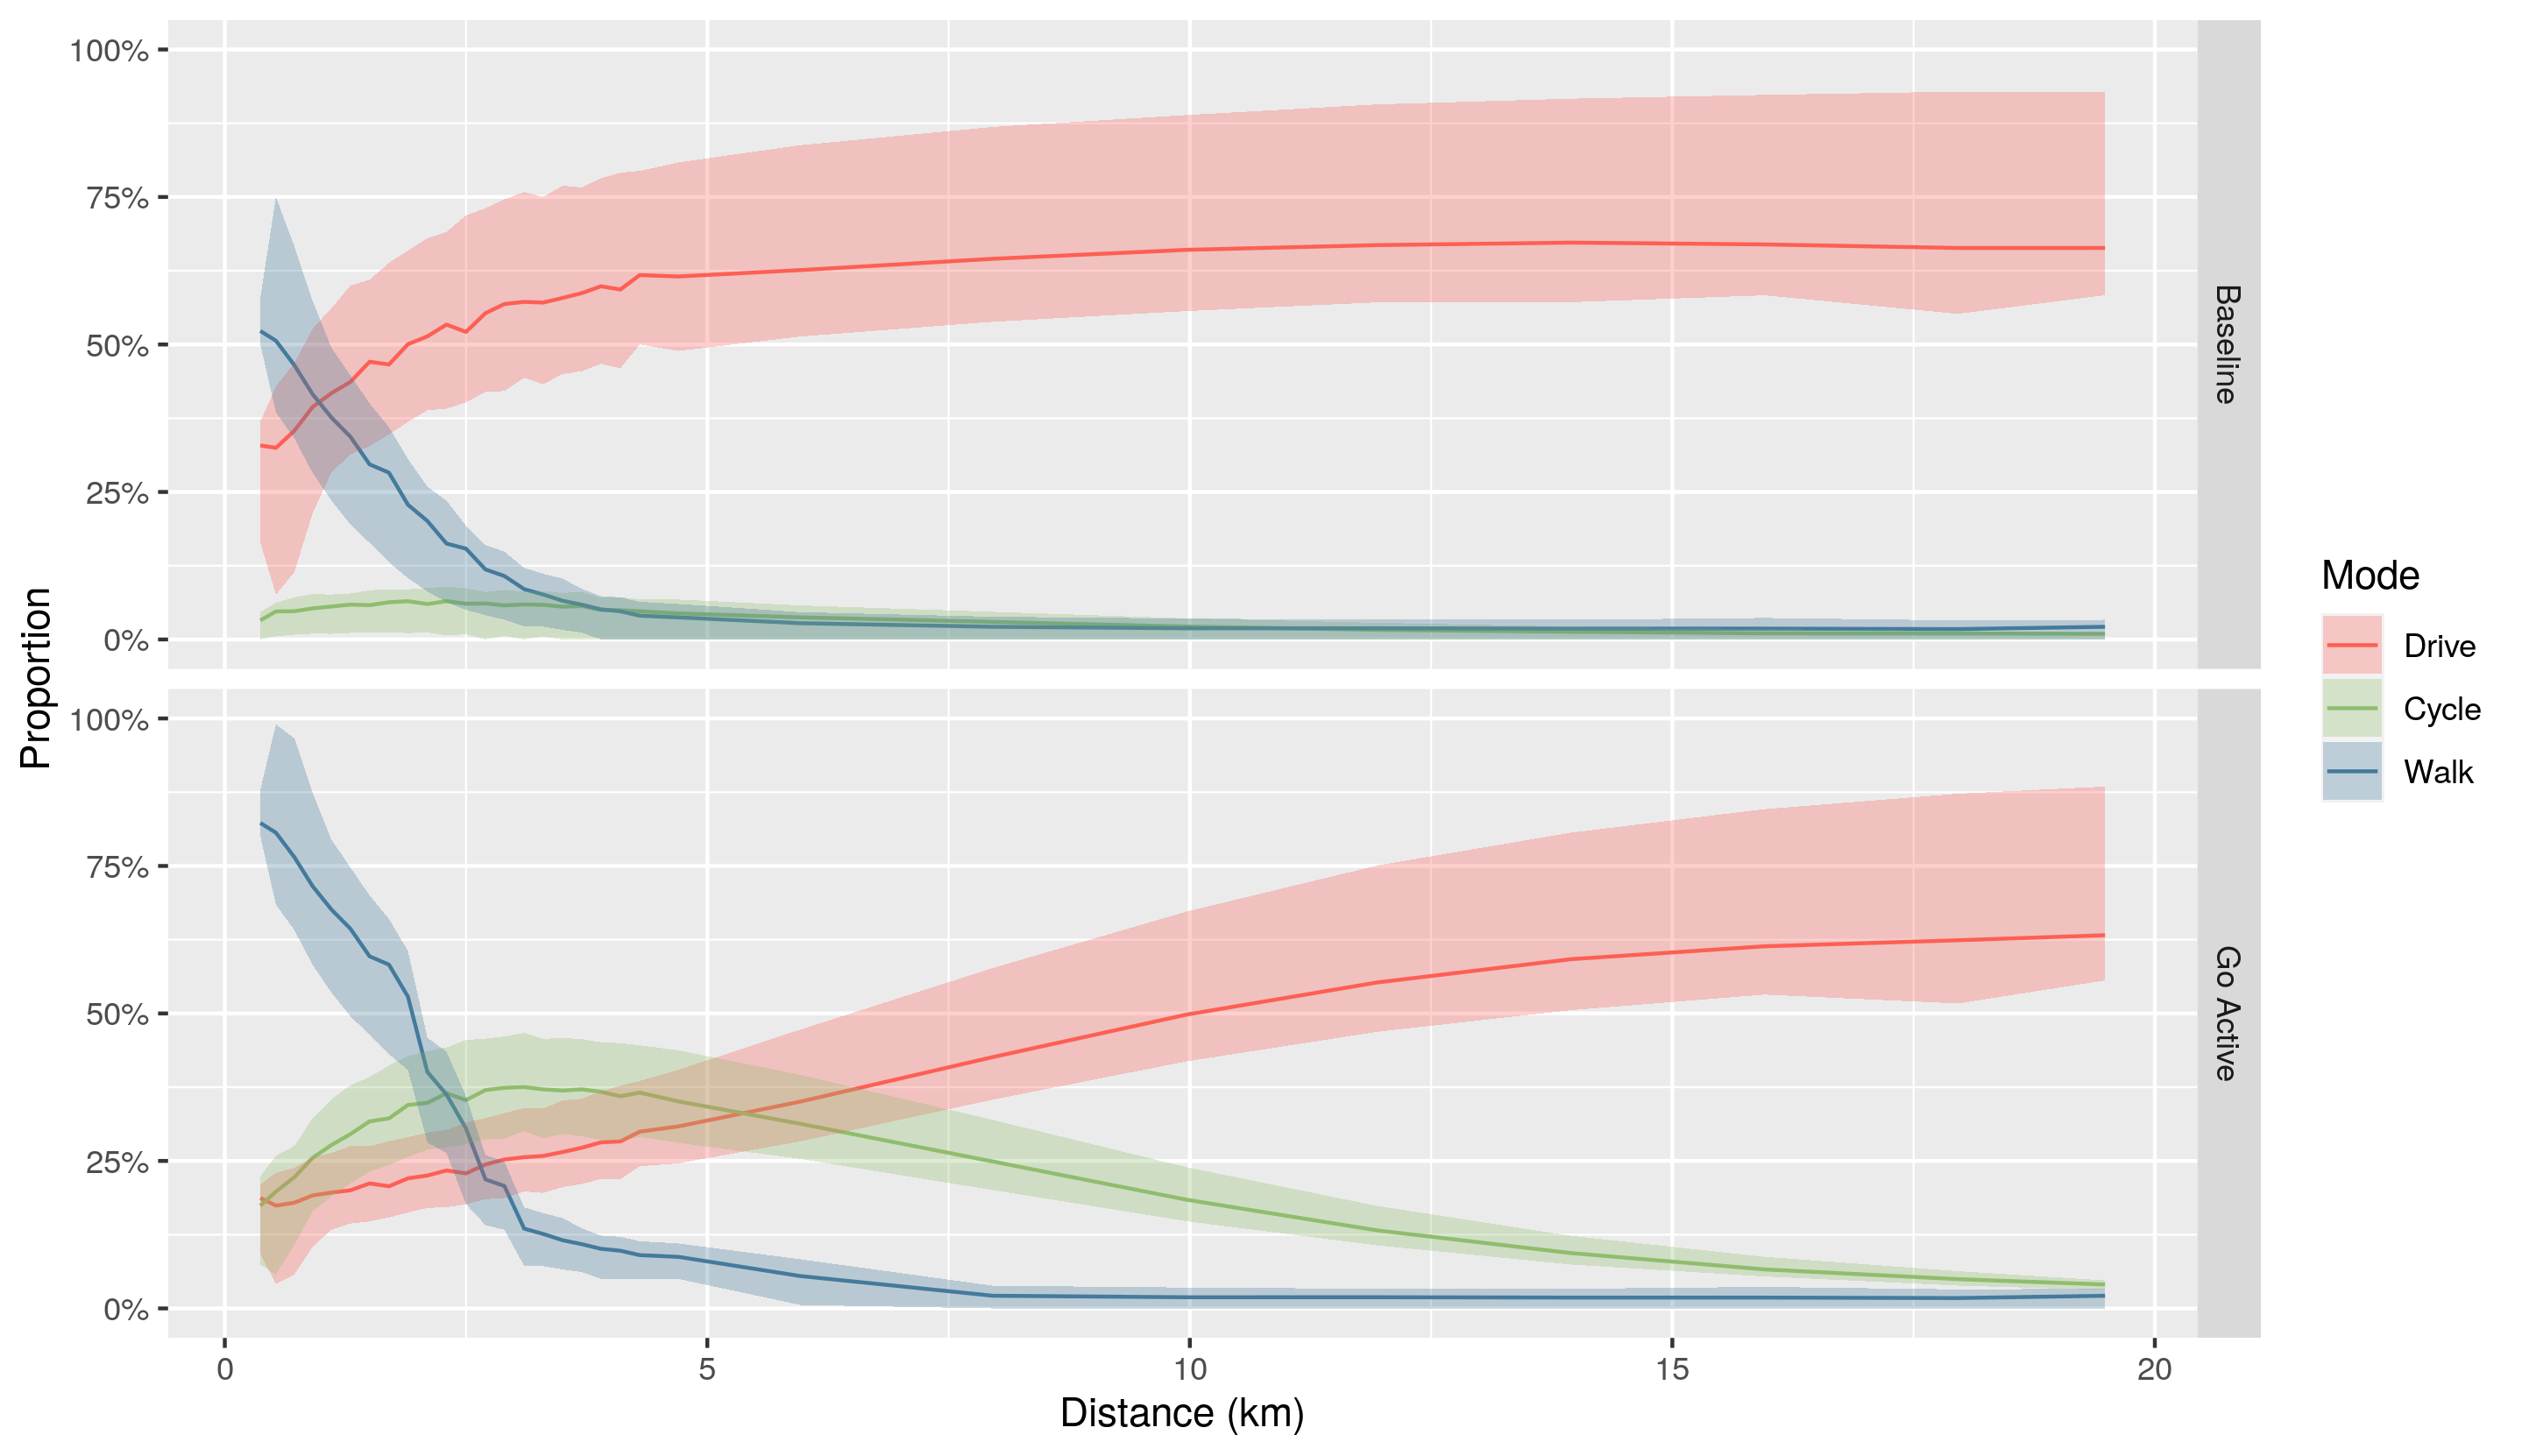
### Experience working with OD data
Adding value and detail to existing OD data.
Source: Lovelace, Félix and Carlino ([2022](https://osf.io/qux6g/) preprint)

---
### From OD data to travel behaviour
Source: Lovelace, Félix and Carlino ([2022](https://osf.io/qux6g/) preprint)

---
### Validating synthetic OD datasets
Source: Lovelace, Félix and Carlino ([2022](https://osf.io/qux6g/) preprint)

---
### Scalability vs resolution
Source: [UKRI CREDS project repo](https://github.com/creds2/od-data)

---
### OA-WPZ data
There are 17,848,366 OA to WPZ records, 170k OAs, 54k WPZ
For 5km buffer around London, 1.5 million OD pairs with destinations
[](https://rpubs.com/RobinLovelace/863109)
---
### Reproducible example
.left-column[
```{r, echo=TRUE}
u = "https://github.com/ITSLeeds/od/releases/download/v0.3.1/od_intra_top_sf.geojson"
desire_lines_oa_wpz_1k = sf::read_sf(u)
oas_in_buffer = sf::read_sf("https://github.com/ITSLeeds/od/releases/download/v0.3.1/oas_in_buffer.geojson")
wpz_in_buffer = sf::read_sf("https://github.com/ITSLeeds/od/releases/download/v0.3.1/wpz_in_buffer.geojson")
library(tmap)
tmap_mode("view")
m = tm_shape(desire_lines_oa_wpz_1k) +
tm_lines() +
tm_shape(oas_in_buffer) + tm_dots(col = "darkgreen") +
tm_shape(wpz_in_buffer) + tm_dots(col = "darkred")
```
]
.right-column[
```{r}
m
```
]
---
### Data sources for movement estimates
.pull-left[
## Open data
- Traffic count data
- Urban Observatory type data (Newcastle, Birmingham, Manchester)
- Faceboook and Google open mobility data
- 'OSM2od' - spatial interaction model
- Modelled data
- jittering: spatial disaggregation
- temporal disaggregation
- Scenarios of change - e.g. Go Dutch open data estimates of cycling potential
]
.pull-right[
## Proprietary data
- National Travel Survey
- Mobile Telephone Data
- Large GPS type data (biobank, Google timeline, Straval)
]
---
## From OD data to policy tools
.left-column[
Lead Developer of the DfT's PCT (Lovelace et al. 2017) : transformational impact on planning in the UK (source: REF Impact Case Study)
COVID response: RAPID tool (Lovelace et al. 2020)
ActDev tool for informing planning process
]
.right-column[
<iframe width="560" height="315" src="https://www.youtube.com/embed/nNYroA16JEQ?start=120" title="YouTube video player" frameborder="0" allow="accelerometer; autoplay; clipboard-write; encrypted-media; gyroscope; picture-in-picture" allowfullscreen></iframe>
]
---
# Open source software, community building
- New high performance libraries

---
.left-column[
## OD data and policy
Close working relationship with DfT over past 6 years
Collaborations with Ordnance Survey (LIDA), National Highways (training), links with DLUHC and Open Innovation Team
Transport behaviour, infrastructure, safety, energy
]
.right-column[

]
---
.left-column[
# Ideas
Hackathons
Active travel
Road safety policy
Post COVID recovery
Levelling up metrics
Nature recovery networks
Citizen science and data literacy
]
.right-column[
]
---
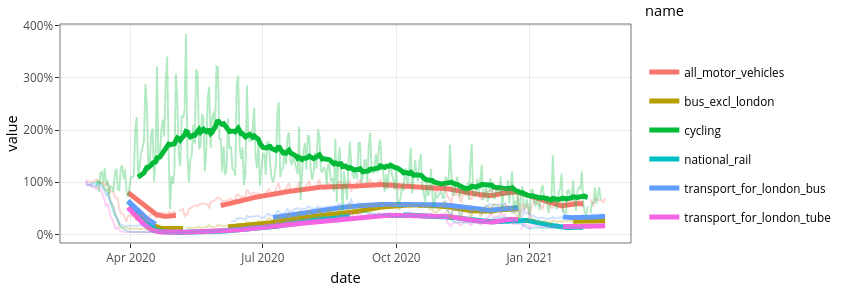
## Example: Climate change, what data science can bring
.left-column[
Emotive and potentially polarising issue
Data can provide a shared starting point
Nationally scenarios are vital
Locally, visions, trust, buy-in and participation are key
]
.right-column[
<!-- <iframe src="https://ourworldindata.org/grapher/annual-co-emissions-by-region" loading="lazy" style="width: 100%; height: 600px; border: 0px none;"></iframe> -->
```{r, eval=FALSE, echo=FALSE}
piggyback::pb_upload("annual-co-emissions-by-region.csv")
piggyback::pb_download_url("annual-co-emissions-by-region.csv")
```
```{r, include=FALSE}
emissions = readr::read_csv("https://github.com/Robinlovelace/presentations/releases/download/2020-02/annual-co-emissions-by-region.csv")
emissions = emissions %>% rename(Emissions = `Annual CO2 emissions (zero filled)`)
emissions_regions = emissions %>%
filter(is.na(Code)) %>%
filter(Entity != "World") %>%
filter(!str_detect(string = Entity, pattern = "EU|Fr|Ku|Leew|exc|Pan|Ry|St"))
```
```{r}
g = ggplot(emissions_regions) +
geom_line(aes(Year, Emissions, colour = Entity), show.legend = FALSE)
plotly::ggplotly(g)
```
]
???
The Downward trend during coronavirus saw emissions drop by ~10%
The scale of the challenge is to reduce emissions by 10% every year, every year, and the challenge gets hard with each year
That means: we need transformational
---
### Decarbonisation
<iframe src="https://ourworldindata.org/grapher/co2-mitigation-2c" loading="lazy" style="width: 100%; height: 600px; border: 0px none;"></iframe>
---
# Making UK data come to life

Source: Lovelace, Tennekes, Carlino ([under review](https://zonebuilders.github.io/zonebuilder/articles/paper.html))

---
class: center, middle
# Thanks, look forward to working with you 🖧 + 📈 + ✨ = 🚀!
--
## References
--
Lovelace, R., Goodman, A., Aldred, R., Berkoff, N., Abbas, A., Woodcock, J., 2017. The Propensity to Cycle Tool: An open source online system for sustainable transport planning. Journal of Transport and Land Use 10. https://doi.org/10.5198/jtlu.2016.862
--
Morgan, M., Lovelace, R., 2020. Travel flow aggregation: nationally scalable methods for interactive and online visualisation of transport behaviour at the road network level. Environment & Planning B: Planning & Design. https://doi.org/10.1177/2399808320942779
--
Lovelace, R., Tennekes, M., Carlino, D., 2021. ClockBoard: a zoning system for urban analysis. https://doi.org/10.31219/osf.io/vncgw
--
Lovelace, Robin, Rosa Félix, and Dustin Carlino. “Jittering: A Computationally Efficient Method for Generating Realistic Route Networks from Origin-Destination Data.” OSF Preprints, January 13, 2022. https://doi.org/10.31219/osf.io/qux6g.