-
Notifications
You must be signed in to change notification settings - Fork 1
Expand file tree
/
Copy pathtds-regional-street.Rmd
More file actions
618 lines (413 loc) · 16.5 KB
/
tds-regional-street.Rmd
File metadata and controls
618 lines (413 loc) · 16.5 KB
1
2
3
4
5
6
7
8
9
10
11
12
13
14
15
16
17
18
19
20
21
22
23
24
25
26
27
28
29
30
31
32
33
34
35
36
37
38
39
40
41
42
43
44
45
46
47
48
49
50
51
52
53
54
55
56
57
58
59
60
61
62
63
64
65
66
67
68
69
70
71
72
73
74
75
76
77
78
79
80
81
82
83
84
85
86
87
88
89
90
91
92
93
94
95
96
97
98
99
100
101
102
103
104
105
106
107
108
109
110
111
112
113
114
115
116
117
118
119
120
121
122
123
124
125
126
127
128
129
130
131
132
133
134
135
136
137
138
139
140
141
142
143
144
145
146
147
148
149
150
151
152
153
154
155
156
157
158
159
160
161
162
163
164
165
166
167
168
169
170
171
172
173
174
175
176
177
178
179
180
181
182
183
184
185
186
187
188
189
190
191
192
193
194
195
196
197
198
199
200
201
202
203
204
205
206
207
208
209
210
211
212
213
214
215
216
217
218
219
220
221
222
223
224
225
226
227
228
229
230
231
232
233
234
235
236
237
238
239
240
241
242
243
244
245
246
247
248
249
250
251
252
253
254
255
256
257
258
259
260
261
262
263
264
265
266
267
268
269
270
271
272
273
274
275
276
277
278
279
280
281
282
283
284
285
286
287
288
289
290
291
292
293
294
295
296
297
298
299
300
301
302
303
304
305
306
307
308
309
310
311
312
313
314
315
316
317
318
319
320
321
322
323
324
325
326
327
328
329
330
331
332
333
334
335
336
337
338
339
340
341
342
343
344
345
346
347
348
349
350
351
352
353
354
355
356
357
358
359
360
361
362
363
364
365
366
367
368
369
370
371
372
373
374
375
376
377
378
379
380
381
382
383
384
385
386
387
388
389
390
391
392
393
394
395
396
397
398
399
400
401
402
403
404
405
406
407
408
409
410
411
412
413
414
415
416
417
418
419
420
421
422
423
424
425
426
427
428
429
430
431
432
433
434
435
436
437
438
439
440
441
442
443
444
445
446
447
448
449
450
451
452
453
454
455
456
457
458
459
460
461
462
463
464
465
466
467
468
469
470
471
472
473
474
475
476
477
478
479
480
481
482
483
484
485
486
487
488
489
490
491
492
493
494
495
496
497
498
499
500
501
502
503
504
505
506
507
508
509
510
511
512
513
514
515
516
517
518
519
520
521
522
523
524
525
526
527
528
529
530
531
532
533
534
535
536
537
538
539
540
541
542
543
544
545
546
547
548
549
550
551
552
553
554
555
556
557
558
559
560
561
562
563
564
565
566
567
568
569
570
571
572
573
574
575
576
577
578
579
580
581
582
583
584
585
586
587
588
589
590
591
592
593
594
595
596
597
598
599
600
601
602
603
604
605
606
607
608
609
610
611
612
613
614
615
616
617
---
title: "Transport Data Science: from regional to street levels"
subtitle: "`r emojifont::emoji('rocket')`<br/>Emerging discipline and community of practice?"
author: "Robin Lovelace"
institute: "University of Leeds"
date: "Louvain-la-Neuve, 2020-02-07 (updated: `r Sys.Date()`)"
output:
xaringan::moon_reader:
css: [default, robot, robot-fonts]
lib_dir: libs
nature:
beforeInit: "https://platform.twitter.com/widgets.js"
highlightStyle: github
highlightLines: true
countIncrementalSlides: false
---
background-image: url(https://d3l4am9dimtbet.cloudfront.net/wp-content/uploads/2018/07/In-Pics_-These-Mind-Blowing-Aerial-Shots-of-Mumbai-Were-Taken-by-a-Drone.jpg)
<!-- 14h30-15h30 lecture part (this could already drift towards the practical part but doesn't have to ...) -->
<!-- 15:30-16h00 coffee break -->
<!-- 16h00-17h00 hands-on workshop (could be somewhat open-ended, we'll have the room all afternoon - but if we would go into extra time, we should make a short 'cut' around 17h such that those who have/want to go home can do so). -->
# Introduction
Source: [thebetterindia.com](https://www.thebetterindia.com/148450/mumbai-aerial-shots/)
<!-- Mumbai is by [some](https://www.independent.co.uk/travel/worlds-biggest-cities-mexico-city-new-york-karachi-tokyo-lagos-kolkata-kinshasa-dhaka-delhi-a8158426.html) measures the world's largest city -->
--
Abstract:
Data Science has emerged as an area of high and consistent growth in many sectors. High tech industries such as search engine optimisation, marketing and retail analytics have been quick to adopt new workflows. Transport has arguably been slow to adapt to the transformations towards open source software (as opposed to proprietary products that still dominate), command line and scriptable interfaces (unlike the graphical user interfaces of tools such as Excel) and code sharing and version development via platforms such as GitHub.
This talk demonstrates these new workflows, building on the [Transport chapter in the open source book Geocomputation with R](https://geocompr.robinlovelace.net/transport.html) and experience developing and deploying data science tools that are having a real world impact on transport policy and practice. It will provide insight into how multiple geographic scales of analysis were used to develop the [Propensity to Cycle Tool](http://www.pct.bike/), which Robin developed in collaboration with colleagues from 4 universities and which is being used by dozens of Local Authorities to develop strategic cycle networks. Furthermore, a live demo of the recently release [stats19](https://docs.ropensci.org/stats19/) package, which provides fast access to crash data for road safety research, will highlight the power of reproducibility and that transport data science is a practical field best discovered by doing it and collaboration using reproducible code.
```{r, eval=FALSE}
# to reproduce these slides do:
pkgs = c("rgdal", "sf", "geojsonsf")
install.packages(pkgs)
```
--
```{r setup, include=FALSE}
options(htmltools.dir.version = FALSE)
```
---
## whoami
```{r}
system("whoami")
```
--
.pull-left[
- Environmental geographer
- Learned R for PhD on energy and transport
- Now work at the University of Leeds (ITS and LIDA)
- Focus: Applied geocomputation
- Strong interest in technology + reproducibility, e.g.:
```{r, eval=FALSE}
devtools::install_github("r-rust/gifski")
system("youtube-dl https://youtu.be/CzxeJlgePV4 -o v.mp4")
system("ffmpeg -i v.mp4 -t 00:00:03 -c copy out.mp4")
system("ffmpeg -i out.mp4 frame%04d.png ")
f = list.files(pattern = "frame")
gifski::gifski(f, gif_file = "g.gif", width = 200, height = 200)
```
]
--
.pull-right[
Image credit: Jeroen Ooms + others
```{r, out.width="100%"}
knitr::include_graphics("https://user-images.githubusercontent.com/1825120/39661313-534efd66-5047-11e8-8d99-a5597fe160ff.gif")
```
]
---
## Importance of Geographic data
.pull-left[
### Geographic data is everywhere
### Underlies some of society's biggest issues
### Can give general analyses local (actionable) meaning
]
--
.pull-right[
```{r, echo=FALSE}
knitr::include_graphics("https://raw.githubusercontent.com/npct/pct-team/master/figures/Leeds-network.png")
```
Example: Propensity to Cycle Tool (PCT) in Manchester: http://pct.bike/m/?r=greater-manchester
]
---
# Classifying transport data
Source: https://www.openstreetmap.org/edit#map=14/50.6711/4.6185
```{r, echo=FALSE}
knitr::include_graphics("https://user-images.githubusercontent.com/1825120/73912683-0f369980-48ad-11ea-9139-e24919a45368.png")
```
--
---
---
## Information and data pyramids
Data science is climbing the DIKW pyramid
```{r, echo=FALSE, out.width="70%"}
knitr::include_graphics("https://upload.wikimedia.org/wikipedia/commons/thumb/0/06/DIKW_Pyramid.svg/220px-DIKW_Pyramid.svg.png")
```
--
Data science *can* convert data to information and graphics but *cannot*, on its own, create knowledge, let alone wisdom
---
## A geographic availability pyramid
- Recommendations
- Build this here!
- City-specific datasets
- Bristol cycle count data
- Hard-to-access national data
- Open international/national datasets
- Open origin-destination data from UK Census
- Globally available, low-grade data (bottom)
- OpenStreetMap, Elevation data
---
## An ease-of access pyramid
- Data provision packages
- Use the pct package
- stats19 package
- Pre-processed data
- E.g. downloading data from website www.pct.bike
- Messy official data
- Raw STATS19 data
---
## A geographic level of detail pyramid
- Agents
- Route networks
- Nodes
- Routes
- Desire lines
- Transport zones
---
## Observations
- Official sources are often smaller in sizes but higher in Quality
- Unofficial sources provide higher volumes but tend to be noisy, e.g.: https://onlinelibrary.wiley.com/doi/full/10.1111/gean.12081
- Another way to classify data is by quality: signal/noise ratios
- Globally available datasets would be at the bottom of this pyramid; local surveys at the top.
Source: https://geocompr.robinlovelace.net/read-write.html
- Which would be best to inform policy?
---
## Portals
- UK geoportal, providing geographic data at many levels: https://geoportal.statistics.gov.uk
- Other national geoportals exist, such as this: http://www.geoportal.org/
- A good source of cleaned origin destination data is the Region downloads tab in the Propensity to Cycle Tool - see the Region data tab for West Yorkshire here, for example: http://www.pct.bike/m/?r=west-yorkshire
- OpenStreetMap is an excellent source of geographic data with global coverage. You can download data on specific queries (e.g. highway=cycleway) from the overpass-turbo service: https://overpass-turbo.eu/ or with the **osmdata** package
---
## Online lists
For other datasets, search online! Good starting points in your research may be:
- The open data section in Geocomputation with R - https://geocompr.robinlovelace.net/read-write.html#retrieving-data
- Transport datasets mentioned here: https://data.world/datasets/transportation
- UK government transport data: https://ckan.publishing.service.gov.uk/publisher/department-for-transport
---
## Data packages
- The **openrouteservice** github package provides routing data
- The stats19 package can get road crash data for anywhere in Great Britain [@lovelace_stats19_2019] see here for info: https://itsleeds.github.io/stats19/
- The pct package provides access to data in the PCT: https://github.com/ITSLeeds/pct
- There are many other R packages to help access data
---
## Example: osmdata
```{r, eval=FALSE, echo=FALSE}
# remotes::install_github("itsleeds/geofabrik")
library(geofabrik)
library(osmdata)
library(sf)
system.time({ # around 2 seconds
louvain = opq("louvain-la-neuve") %>%
add_osm_feature("highway", value = "primary|secondary|cycleway", value_exact = F) %>%
osmdata_sf()
})
louvain_highway = louvain$osm_lines
plot(louvain_highway)
saveRDS(louvain_highway, "louvain_highway.Rds")
piggyback::pb_upload("louvain_highway.Rds")
```
```{r, eval=FALSE, echo=FALSE}
louvain_highway = readRDS("louvain_highway.Rds")
```
.pull-left[
``` r
library(osmdata)
library(sf)
system.time({ # around 2 seconds
n = "louvain-la-neuve"
v = "primary|secondary|cycleway"
louvain = opq(n) %>%
add_osm_feature("highway", v,
value_exact = F) %>%
osmdata_sf()
})
#> user system elapsed
#> 0.125 0.020 1.814
louvain_highway = louvain$osm_lines
plot(louvain_highway)
```
]
--
.pull-right[
```{r, echo=FALSE}
knitr::include_graphics("https://i.imgur.com/09yWU7V.png")
```
]
---
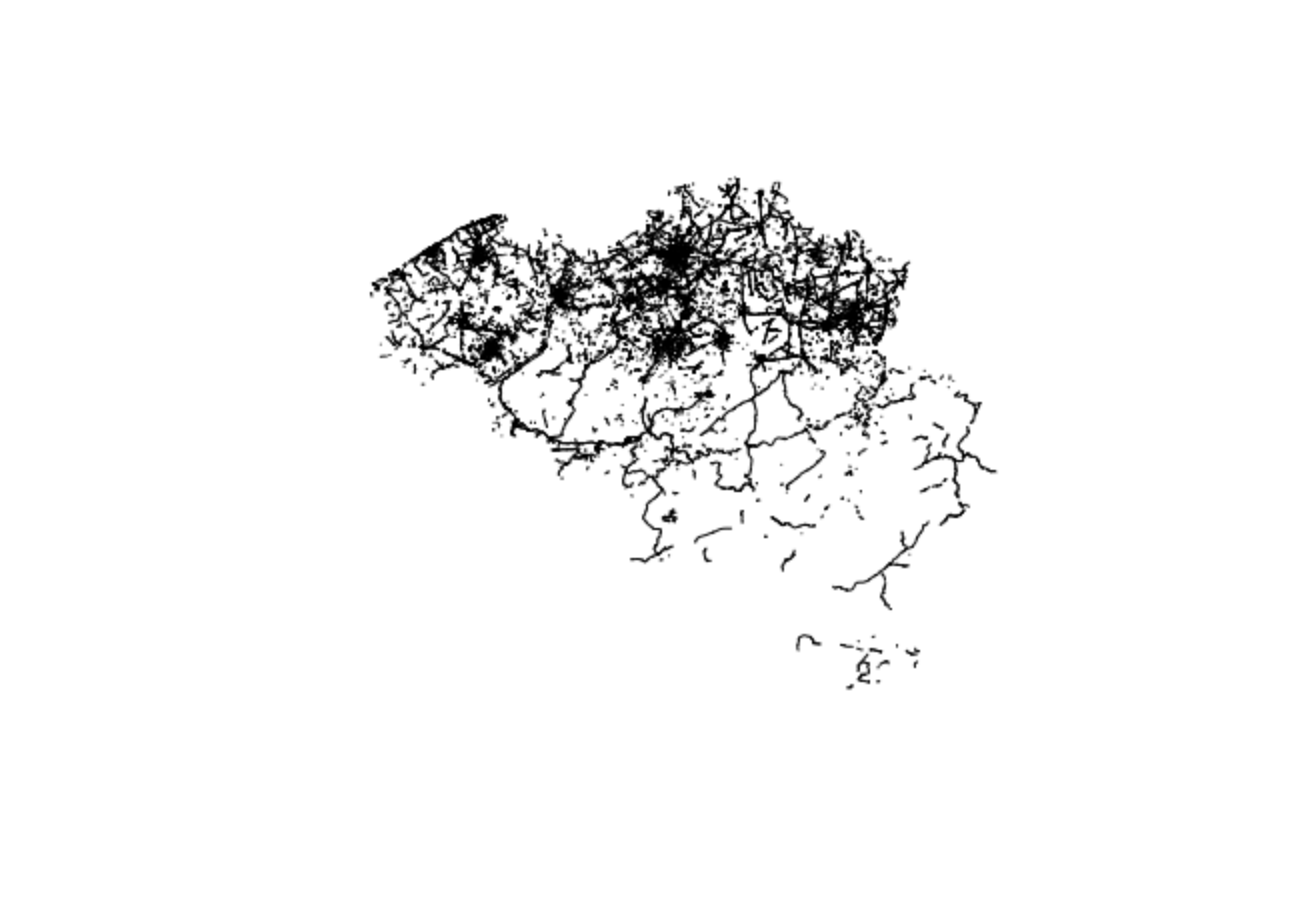
## Example: geofabrik
```{r, eval=FALSE, echo=FALSE}
# remotes::install_github("itsleeds/geofabrik")
library(geofabrik)
lvn_centroid = tmaptools::geocode_OSM("louvain-la-neuve", as.sf = T)
system.time({
# belgium = get_geofabrik(lvn_centroid) # warning: downloads giant file
belgium = get_geofabrik("Beligium") # equivalent code
})
object.size(belgium)
saveRDS(belgium, "belgium_lines.Rds")
file.size("belgium_lines.Rds")
louvain_highway
plot(louvain_highway)
```
``` r
# remotes::install_github("itsleeds/geofabrik")
library(geofabrik)
lvn_centroid = tmaptools::geocode_OSM("louvain-la-neuve", as.sf = T)
system.time({
# belgium = get_geofabrik(lvn_centroid) # warning: downloads giant file
belgium = get_geofabrik("Beligium") # equivalent code
})
#> although coordinates are longitude/latitude, st_contains assumes that they are planar
#> The place is within these geofabrik zones: Europe, Belgium
#> Selecting the smallest: Belgium
#> Downloading http://download.geofabrik.de/europe/belgium-latest.osm.pbf to
#> ~/h/data/osm/Belgium.osm.pbf
#> Old attributes: attributes=name,highway,waterway,aerialway,barrier,man_made
#> New attributes: attributes=name,highway,waterway,aerialway,barrier,man_made,maxspeed,oneway,building,surface,landuse,natural,start_date,wall,service,lanes,layer,tracktype,bridge,foot,bicycle,lit,railway,footway
#> Using ini file that can can be edited with file.edit(/tmp/RtmprktWUQ/ini_new.ini)
#> user system elapsed
#> 72.514 18.150 269.507
plot(louvain_highway)
```
<sup>Created on 2020-02-06 by the [reprex package](https://reprex.tidyverse.org) (v0.3.0)</sup>
--
#### We made our code 100+ times slower!
--
#### ~30 times slower excluding download time
---
## Geofabrik II: pre-downloaded data and filtering
```{r}
belgium_filename = geofabrik::gf_filename("Belgium")
belgium_filename
utils:::format.object_size(file.size(belgium_filename), units = "MB")
# Around 1 GB in RAM...
```
```{r, eval=FALSE}
library(geofabrik)
system.time({
belgium_cycleway = get_geofabrik("Belgium", key = "highway", value = "cycleway")
})
#> user system elapsed
#> 23.658 1.933 23.130
format(object.size(belgium_cycleway), units = "MB")
#> [1] "36.9 Mb"
```
```{r, eval=FALSE, echo=FALSE}
# save belgium_cycleway object
saveRDS(belgium_cycleway, "belgium_cycleway.Rds")
file.size("belgium_cycleway.Rds") # 4 MB
piggyback::pb_upload("belgium_cycleway.Rds")
```
--
#### 'Only' ~10 times slower now
---
## Preprocessing bulk OSM extracts
```{r}
# piggyback::pb_download_url("belgium_cycleway.Rds")
u = "https://github.com/Robinlovelace/presentations/releases/download/2020-02/belgium_cycleway.Rds"
f = "belgium_cycleway.Rds"
if(!file.exists(f)) {
download.file(url = u, destfile = f)
}
system.time({
belgium_cycleway = readRDS("belgium_cycleway.Rds")
})
format(object.size(belgium_cycleway), units = "MB")
```
#### Now ~10 times faster!
--
#### And 10 times more useful?
---
## Spatial subsetting
```{r, eval=FALSE}
lvn_box = stplanr::geo_bb(louvain_highway)
mapview::mapview(lvn_box)
system.time({
lvn_lines = belgium[lvn_box, ]
})
#> user system elapsed
#> 8.767 0.142 8.911
```
```{r, eval=FALSE, echo=FALSE}
saveRDS(lvn_lines, "lvn_lines.Rds")
piggyback::pb_upload("lvn_lines.Rds")
```
```{r}
piggyback::pb_download_url("lvn_lines.Rds")
u = "https://github.com/Robinlovelace/presentations/releases/download/2020-02/lvn_lines.Rds"
f = "lvn_lines.Rds"
if(!file.exists(f)) download.file(url = u, destfile = f)
system.time({
lvn_lines = readRDS("lvn_lines.Rds")
})
format(object.size(lvn_lines), units = "MB")
```
---
## Visualising spatial networks
```{r}
library(sf)
plot(lvn_lines["highway"])
```
---
## Highway types + data cleaning
```{r}
summary(as.factor(lvn_lines$highway))
```
```{r, message=FALSE}
# the tidyverse way:
library(dplyr)
lvn_lines = lvn_lines %>% mutate(highway2 = case_when(
stringr::str_detect(highway, "const|corri|eleva|_link|plat|unc") ~ as.character(NA),
TRUE ~ lvn_lines$highway
))
```
---
## Cleaning II
```{r}
# (a) base R way
lvn_lines_highway_table = table(lvn_lines$highway)
lvn_lines_highway_table
lvn_lines_to_remove = names(lvn_lines_highway_table)[lvn_lines_highway_table < 89]
lvn_lines_to_remove
lvn_lines$highway3 = lvn_lines$highway
lvn_lines$highway3[lvn_lines$highway3 %in% lvn_lines_to_remove] = NA
```
---
## Results...
```{r}
plot(lvn_lines %>% select(contains("high")))
```
---
## Mapping packages
```{r}
library(tmap)
tm_shape(lvn_lines) + tm_lines("highway3")
```
---
## Interactive mapping
```{r}
tmap_mode("view")
tm_shape(lvn_lines) + tm_lines("highway3")
```
---
## Spatial networks
```{r, eval=FALSE}
remotes::install_github("luukvdmeer/sfnetworks")
```
```{r}
library(sfnetworks)
```
---
## National route network dataset
```{r, eval=FALSE}
plot(sf::st_geometry(belgium_cycleway))
```
---
# TDS for policy
Source: the Propensity to Cycle Tool (PCT) project, demo at www.pct.bike
```{r, echo=FALSE, out.width="90%"}
knitr::include_graphics("https://raw.githubusercontent.com/npct/pct-team/master/figures/front-page-leeds-pct-demo.png")
```
--
Source - https://github.com/npct which hosts national web tool PCT [www.pct.bike](http://www.pct.bike/)
---
## Tools for reproducible research
Transport data science is simply the application of 'data science' to transport
- In terms of technique this means command-line tools for scalable analysis
- Principles: reproducibility, generalisability, (public) accessibility
### Example II: **stats19**
- Package providing access to open access road casualty dataset: https://docs.ropensci.org/stats19/
Used by the Parliamentary library to provide evidence for Members of Parliament (MPs): https://commonslibrary.parliament.uk/economy-business/transport/roads/constituency-data-traffic-accidents/
---
# The practical session
It depends on you level of R skills, in ascending order of difficulty
1. Work through the Transport Chapter (12) in Geocompuation with R
2. Work through an introduction to road safety analysis with R: https://docs.ropensci.org/stats19/articles/stats19-training.html
3. Apply the methods in that chapter to a different UK city (advanced)
4. Have a play with the OSM data for Louvain-la-Neuve, hosted in the releases page of https://github.com/Robinlovelace/presentations (easy-to-hard)
- Visualise the dataset with tmap and other packages (see Chapter 8)
- Undertake spatial network analysis of the data (advanced, see sfnetworks package)
- Devise your own research questions using available data (PhD!)
5. Technical issues: how to convert road network into polygons (see https://github.com/ropensci/stplanr/issues/362 ), how to do 'kriging' on a spatial network (see https://github.com/luukvdmeer/sfnetworks/issues/11 )
<!-- specific stats - kriging on network -->
<!-- geo question -->
---
# Invite
### Interested in spatial networks?
Join us for the first official Spatial Networks Hackathon, May 2020: https://www.eventbrite.it/e/erum2020-satellite-event-hackathon-on-spatial-networks-tickets-90976873277
---
# Thanks!
Contact me at r. lovelace at leeds ac dot uk (email), `@robinlovelace` (twitter + github)
--
Check-out my repos at https://github.com/robinlovelace/
--
For more information on efficient workflows, see our book [*Efficient R Programming*](https://csgillespie.github.io/efficientR/)
--
Thanks to all the R developers who made this possible, including (for this presentation):
[remark.js](https://remarkjs.com), [**knitr**](http://yihui.name/knitr), and [R Markdown](https://rmarkdown.rstudio.com).
Slides created via the R package [**xaringan**](https://github.com/yihui/xaringan).
--
Thanks to everyone for building a open and collaborative communities!
```{r, echo=FALSE, eval=FALSE}
# export code from slides
knitr::purl("tds-regional-street.Rmd")
```