BUG: set Vmax to Voc at STC so extrapolation is always in 4th quad.#73
Conversation
…quadrant four

* add new VocSTC attribute to PVcell
* set Aph to nan if Isc is zero
* add new _VocSTC method to calculate VocSTC attr
* add new Igen property and use everywhere instead of Isc * Aph
* use VocSTC as Vmax and make Vdiode from 3 sections includeing a new
Vquad4 section that spans from Voc to VocSTC with logspace concentrated
around Voc, unless Voc==VocSTC, in which case set Vquad4 from 0.8Voc to Voc
* update calc_series_test_iv.dat and other test values in test_pvcell and
test_setsuns
* set EPS as constant once
* use newton instead of fsolve for calcVcell and calcIcell
* add imagemagick converter to change travisci .svg to show up in pdf docs

Signed-off-by: Mark Mikofski <bwana.marko@yahoo.com>
|
Hi @chetan201, this PR closes #36 an issue that happens sometimes when a bypass diode is on, or there are some modules that are heavily shaded, or whatever, the point is that the max voltage in the IV curve for the shaded/bypasses cell had been determined by an estimate of Voc with Rs=0 and Rsh→∞, but if the cell is too shaded then this value is too low to be Vmax, and to match the voltages of other cells, we had to extrapolate. This caused errors, because the slope at that estimate was totally wrong. This PR fixes that by using a constant, Vmax, estimated by Voc at STC for Vmax always, this value is guaranteed to be in the 4th quadrant always. Therefore there are never issues with extrapolating.
|
|
Hi @chetan201 any update on this? If you're looking for reviewers, I think @bmeyers was the one who originally reported this issue. Let me know if you have any questions. Thanks! -Mark |
|
Hi @mikofski, If you have a short script that I can quickly use to reproduce the bug, that will be great to get me up to speed quick. Alternatively, can you suggest a shade (bypass) scenario I can implement quickly to test this? |
|
So the issue occurs if the max voltage on a parallel string isn't big enough to go around the knee in the IV curve. Then the points that get extrapolated to match the voltages of the other parallel strings is wrong, because it's based on the last two points. This custom extrapolation is defined in For example, if I create a 10x10 PV system of SPR-E321 96-cell modules and set every cell in string no. 1 to 10[W/m^2] from pvmismatch import *
from matplotlib import pyplot as plt
plt.ion()
pvsys = pvsystem.PVsystem()
pvsys.setSuns({1: {pvmod: 0.01 for pvmod in range(10)}})
pvsys.pvstrs[1].plotStr()
plt.tight_layout()
pvsys.plotSys()
plt.tight_layout()
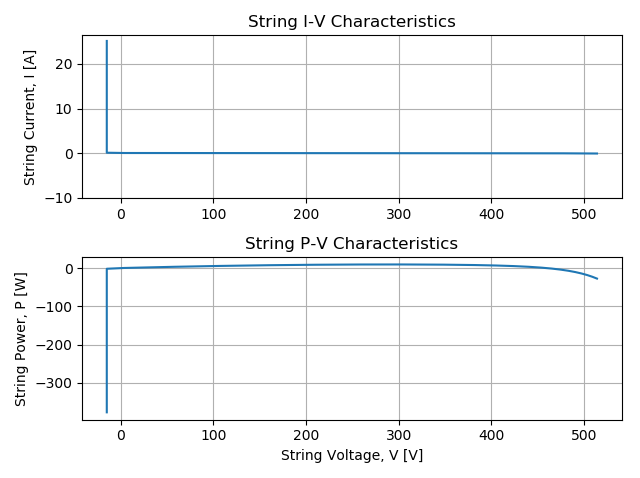
pvsys.PmpThen Pmp degrades from 32117.116666835867[W] to 28848.63489446646[W], due to the shading, and the shaded string's IV curve looks like this:
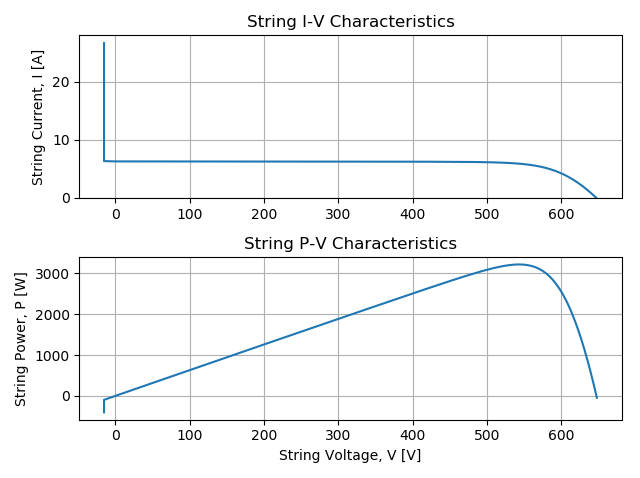
... while an unshaded string looks like this:
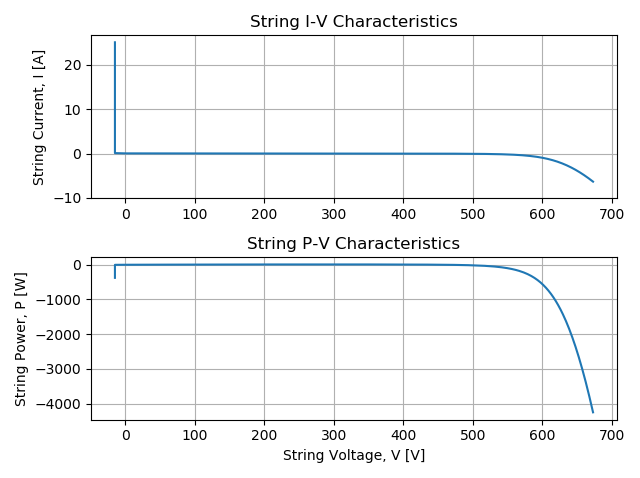
Note how the IV curve turns straight down for the unshaded string, but is still on the "knee" for the shaded string. This is an artifact of the selection of voltage points chosen for that string. The max voltage is fixed at What this PR does is fix Vmax at the estimated Voc at STC conditions, so that it always passes far enough around the knee so that extrapolating to match the voltages of neighboring parallel strings is more accurate. Here's what the same shaded string looks like with gh36 fix:
Now you can see that the Vmax is about 100-volts greater than without the fix, and the slope is not a straight line from where the current IV curve ended. The table below shows difference in sytem power predictions for voltages from the region around and past the knee
... so in this particular example, close to max power, there isn't much of an effect, but as the curve approaches Voc the error explodes. Note: even though the error in Voc is only 0.5%, the slope near Voc is very large, so a small error is voltage is a large error in current or power. |
|
@chetan201 does my example explain this PR and #36 better? Do you see how the linear extrapolation is just wrong if you don't select a high enough Vmax, because the slope is still changing, and you haven't actually gotten to a linear region yet? It's okay if they're wrong in a region we don't care about, but it is very likely that inverters will operate between Vmp and Voc, so this area is important to get correct currents. Let me know if you have more questions. Thanks! |
 chetan201
left a comment
chetan201
left a comment
There was a problem hiding this comment.
@mikofski
I have verified the changes and they look good!
Thanks for implementing this change. It certainly helps for improving the accuracy of the model under wide range of conditions.
Out of curiosity, why the change to newton over fsolve?
| 'sphinx.ext.graphviz'] | ||
| 'sphinx.ext.graphviz', 'sphinx.ext.imgconverter'] | ||
|
|
||
| image_converter = 'c://Program Files//ImageMagick-7.0.7-Q16//convert.exe' |
There was a problem hiding this comment.
where is this program running?
There was a problem hiding this comment.
ImageMagick is used by Sphinx to convert the Travis .svg badge into an image that can be used in a pdf and latex. I installed it, and it works. It's available on all platforms.
|
|
Fixes #36 so that extrapolation into 4th quadrant is more accurate by extending range of voltages all the way to Voc at STC where IV curve actually starts to turn downward, instead of Voc at
(Tc, Ee)which might have the wrong slope.Vquad4 section that spans from Voc to VocSTC with logspace concentrated
around Voc, unless Voc==VocSTC, in which case set Vquad4 from 0.8Voc to Voc
test_setsuns
Signed-off-by: Mark Mikofski bwana.marko@yahoo.com