What is Heap Dump –
A heap dump is a snapshot of the memory of a java application at a certain point in time.
Since it's just a snapshot, hence it does not contain information such as when and where (in which method) an object was allocated
Why to take Heap Dump –
- when a system crashed periodically due to
OOM error - To analyze the
memory footprint of an application - To know the root cause behind
too many garbage objectsbeing created
How to take HeapDump –
- Using cmd line options -
jmap -dump:live,format=b,file=<file-path> <pid>
where is the java process id for which heap dump should be captured
liveoption will only capture live objects on heap, this reduces the size of heap dump & make analysis easier
jmapis a tool to print statistics about memory in a running JVM. We can use it for local or remote processes HeapDumpOnOutOfMemoryError
-XX:+HeapDumpOnOutOfMemoryError -XX:+HeapDumpPath=/opt/tmp/heapdump.binjcmdtool is used to send diagnostic command requests to the JVM,jcmd <pid> GC.heap_dump file=<file=path>JVisualVM- it's a monitoring, troubleshooting tool that is packaged within the JDK, when we launch this tool, it'll displays all the running java processes on local machine, and can connect to them- Using JMX clients such as JConsole, Java Mission Control (using MBeanServer) etc.
- Using
jhatcmd tool - and, through programmatic approach like below code snippets -
package com.tests.examples;

import java.io.IOException;
import java.lang.management.ManagementFactory;

import javax.management.MBeanServer;

import com.sun.management.HotSpotDiagnosticMXBean;

/**
 * @author manoranjan.kumar
 */
public class HeapDump {
	private static final String HOTSPOT_BEAN_NAME = "com.sun.management:type=HotSpotDiagnostic";

	// available in java 11
	private static volatile HotSpotDiagnosticMXBean hotSpotDiagnosticMXBean;

	public static void main(String[] args) throws IOException {
		HeapDump heapDump = new HeapDump();
		heapDump.takeHeapDump("log_heap_dump.hprof", true);
	}

	public void takeHeapDump(String fileName, boolean live) throws IOException {
		initHotSpotMBean();
		hotSpotDiagnosticMXBean.dumpHeap(fileName, live);
	}

	private static void initHotSpotMBean() throws IOException {
		if (hotSpotDiagnosticMXBean == null) {
			synchronized (HeapDump.class) {
				hotSpotDiagnosticMXBean = getHotSpotDiagnosticMXBean();
			}
		}
	}

	private static HotSpotDiagnosticMXBean getHotSpotDiagnosticMXBean() throws IOException {
		MBeanServer server = ManagementFactory.getPlatformMBeanServer();
		return ManagementFactory.newPlatformMXBeanProxy(server, HOTSPOT_BEAN_NAME, HotSpotDiagnosticMXBean.class);
	}
}There are several open-sourced analysis tools in the market, the most common tools are listed as follows:
- Eclipse MAT: it comes in two versions -
StandaloneandEclipse plug-in, better usestandaloneversion - HeapHero:
- JVisualVM:
Eclipse MAT (memory analyzer tool) -
download link: this
code to be analyzed for memory hogging:
package com.tests.examples;

import java.util.HashMap;
import java.util.Map;

/**
 * Replicating OOM Error
 *
 * @author manoranjan.kumar
 */
public class OutOfMemoryError {

    private Map<Object, Object> myMap = new HashMap<>();

    public static void main(String[] args) {
        OutOfMemoryError oom = new OutOfMemoryError();
        oom.grow();
    }

    public void grow() {
        try {
            long counter = 0;
            while (true) {
                myMap.put("key" + counter,
                        "Large String Large String Large String Large String Large String "
                                + "Large String Large String Large String Large String Large String "
                                + "Large String Large String Large String Large String Large String "
                                + "Large String Large String Large String Large String Large String "
                                + "Large String Large String Large String Large String Large String "
                                + "Large String Large String Large String Large String Large String "
                                + "Large String Large String Large String Large String Large String "
                                + "Large String Large String Large String Large String Large String "
                                + "Large String Large String Large String Large String Large String "
                                + "Large String Large String Large String Large String Large String "
                                + "Large String Large String Large String Large String Large String "
                                + "Large String Large String Large String Large String Large String "
                                + "Large String Large String Large String Large String Large String "
                                + "Large String Large String Large String Large String Large String "
                                + "Large String Large String Large String Large String Large String "
                                + "Large String Large String Large String Large String Large String "
                                + "Large String Large String Large String Large String Large String "
                                + "Large String Large String Large String Large String Large String "
                                + "Large String Large String Large String Large String Large String " + counter);
                ++counter;
            }
        } catch (Exception e) {
            // TODO: handle exception
        }
    }
}
Compile and Run the above code with these JVM flags:
java OutOfMemoryError -Xmx1024m -XX:+HeapDumpOnOutOfMemoryError -XX:HeapDumpPath=java_heap_space_oom_heap_dump.bin
it'll throw below error in standard console-
java.lang.OutOfMemoryError: Java heap space
Dumping heap to java_heap_space_oom_heap_dump.bin ...
Heap dump file created [851946015 bytes in 2.321 secs]
Exception in thread "main" java.lang.OutOfMemoryError: Java heap space
	at java.util.Arrays.copyOfRange(Arrays.java:3664)
	at java.lang.String.<init>(String.java:207)
	at java.lang.StringBuilder.toString(StringBuilder.java:407)
	at com.tests.examples.OutOfMemoryError.grow(OutOfMemoryError.java:25)
	at com.tests.examples.OutOfMemoryError.main(OutOfMemoryError.java:17)
Open up this file (java_heap_space_oom_heap_dump.bin) in Eclipse MAT tool, like below
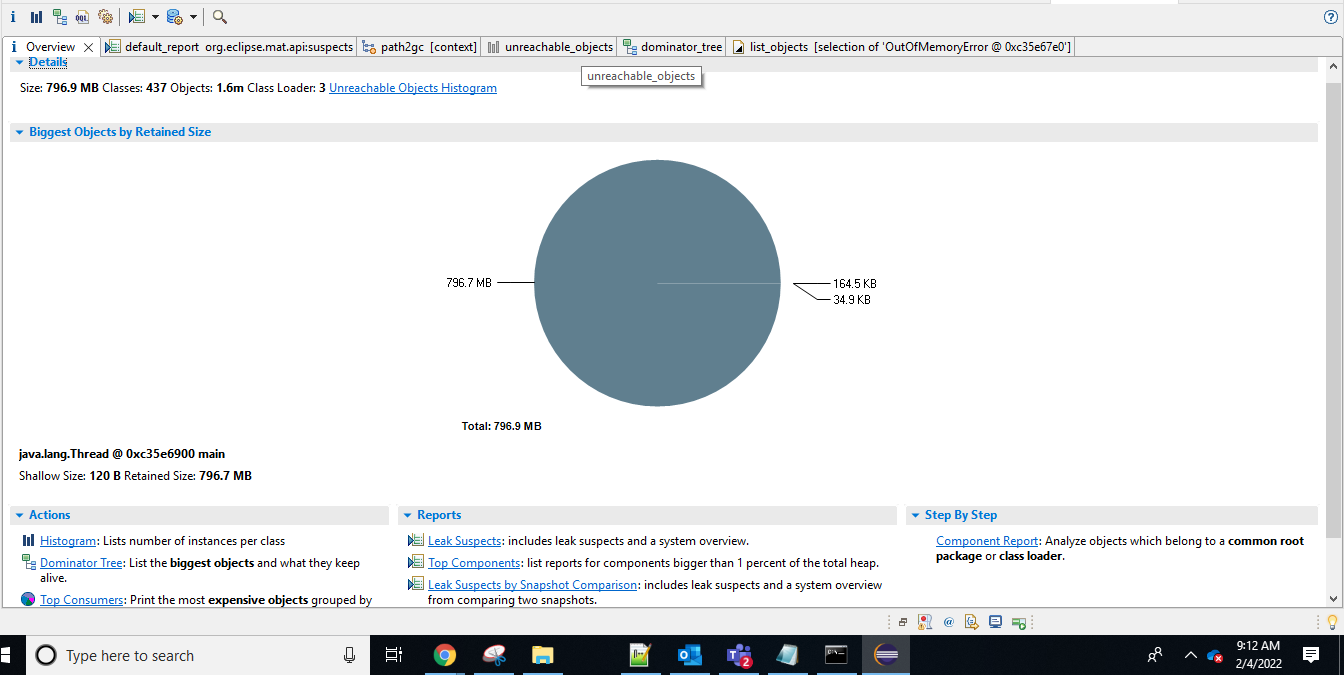
click on Dominator Tree hyper link -
and then expand the first line item having the maximum Retained Heap
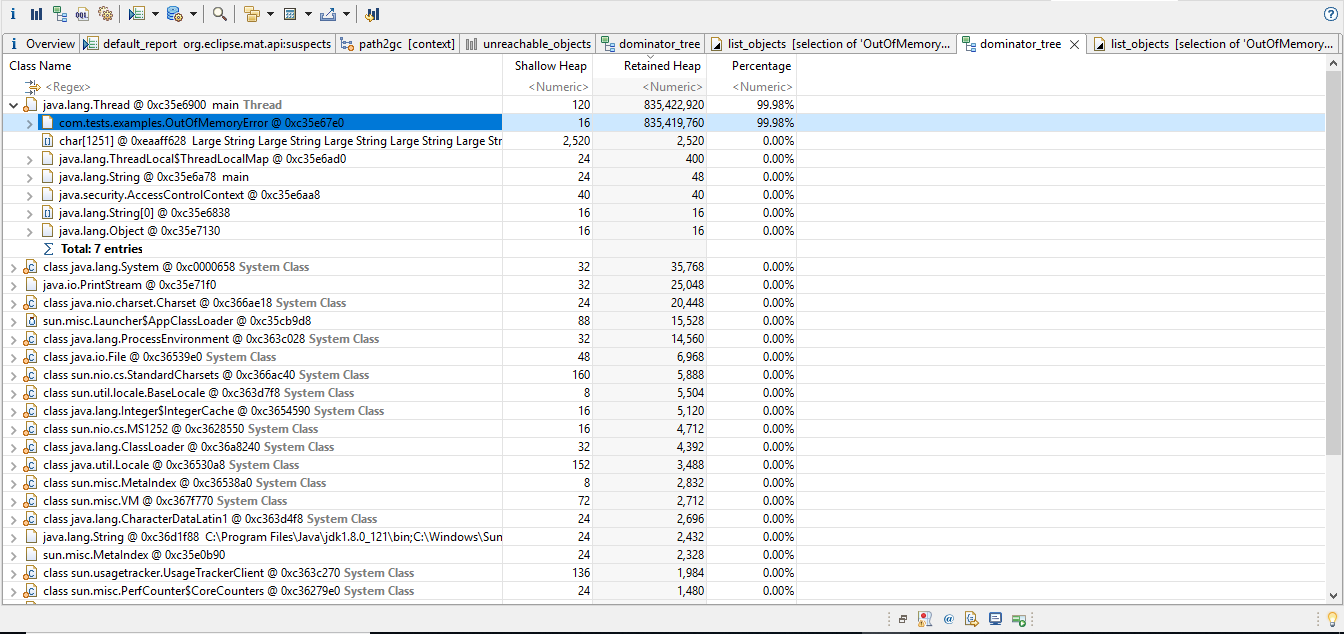
We can clearly notice the higlighted user-defined class name with complete package details which is having highest Retained Heap
Do, right click on it, like below
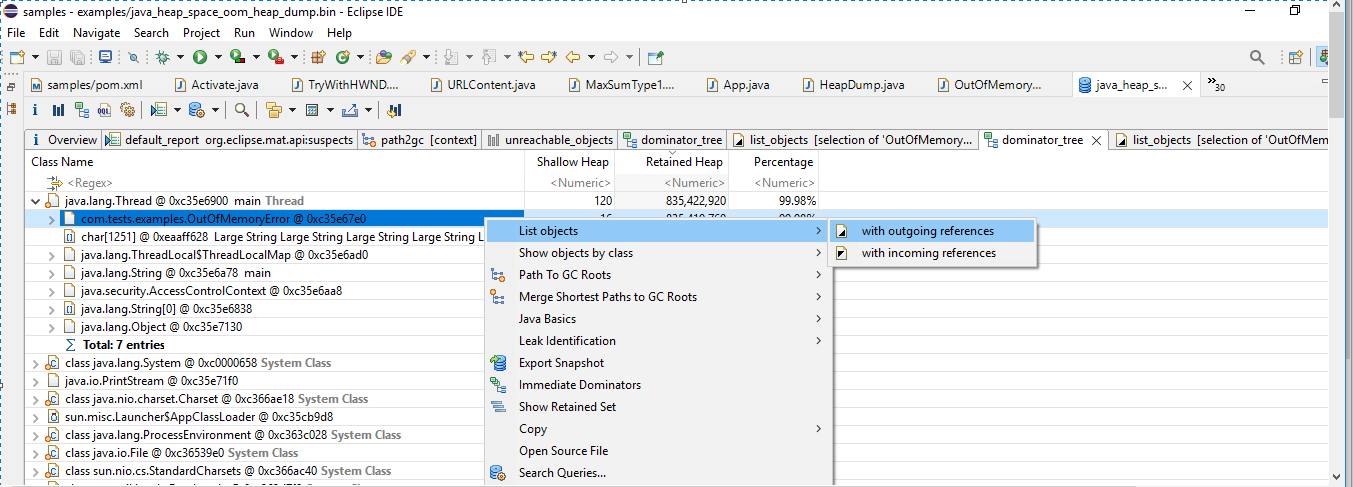
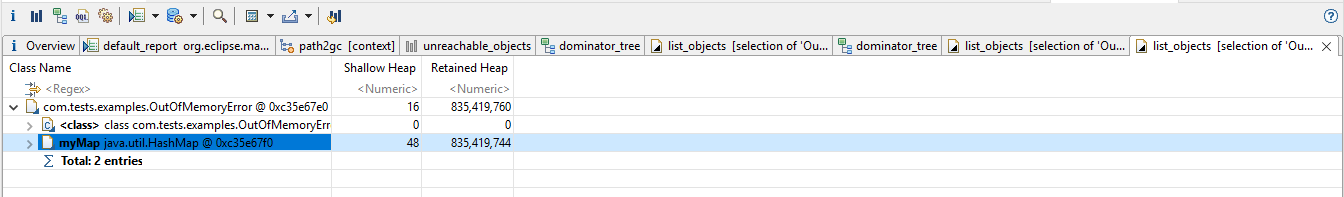
Expand it, and we can pinpoint the exact varible myMap which is causing memory hog as follows-
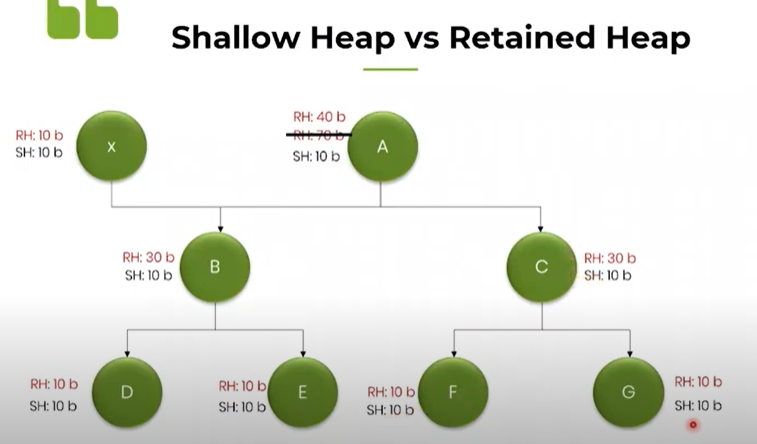
Shallow Heap:
It is the amount of memory occupied by that particular object on Heap.
Retained Heap:
It is the amount of memory that can be collected by GC when a particular object is removed from Heap
The below diagram explains Shallow & Retained Heap concepts clearly:
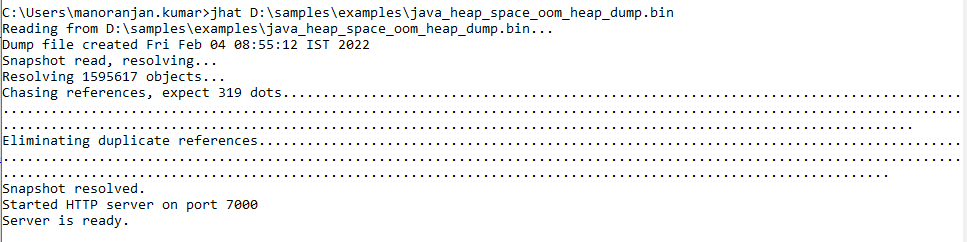
For a quick summary, we can using jhat to analyze heap dumps, but this is mostly in textual format,
hence, it may not be that readable, better use UI based tools
such as, JVisualVM or Eclipse MAT for easier understanding with more features
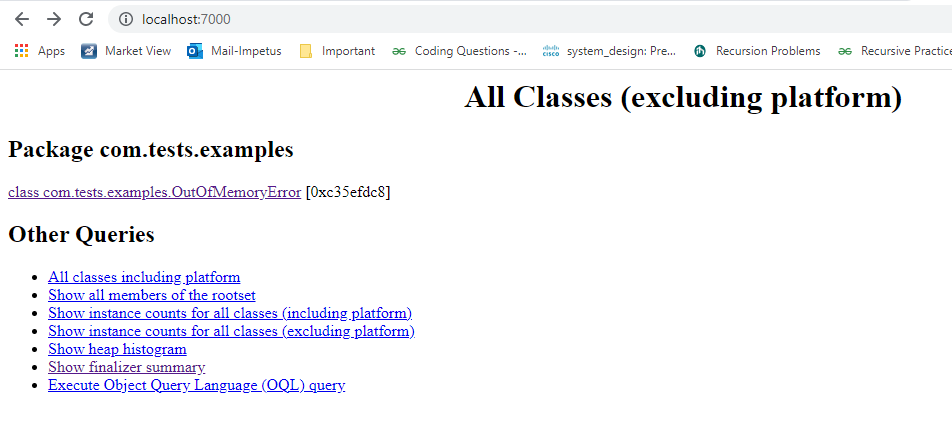
open up the browser and hit localhost:7000
Reference: