https://gist.github.com/ilap/54027fe9af0513c2701dc556221198b2
To skip the reading part :), you can just download this chrony.conf file and use it in place of yours located in /etc/chrony/chrony.conf
https://github.com/lovelypool/cardano_stuff/blob/master/chrony.conf
Lets optimize our settings for Chrony in order to reduce your system clock's time drift! You do not need to install Prometheus or Grafana on your servers to perform this tweak.
sudo apt-get install chrony
sudo systemctl restart chrony
Some useful chrony commands:
- chronyd is your daemon, chronyc is a command line interface to the daemon
chronyc trackingwill output your current system time and its various offsets:
Reference ID    : D8EF2308 (time3.google.com)
Stratum         : 2
Ref time (UTC)  : Sun Dec 29 21:31:56 2019
System time     : 0.000018093 seconds fast of NTP time
Last offset     : +0.000002191 seconds
RMS offset      : 0.000010192 seconds
Frequency       : 31.951 ppm slow
Residual freq   : +0.013 ppm
Skew            : 1.614 ppm
Root delay      : 0.013293287 seconds
Root dispersion : 0.000163152 seconds
Update interval : 2.1 seconds
Leap status     : Normal
chronyc sourceswill output the servers that you are currently connected to for time synchronization.
210 Number of sources = 3
MS Name/IP address         Stratum Poll Reach LastRx Last sample
===============================================================================
^* time3.google.com              1   1   377     1   -196us[ -182us] +/- 7385us
^+ time2.google.com              1   1   377     1   +323us[ +337us] +/-   11ms
^+ time4.google.com              1   1   377     1   +379us[ +393us] +/- 7049us
-
Modify the
poolline to include minpoll and maxpoll parameters. This will set the rate at which how long your system waits to resynchronize again with the server. Keep this low so we can get really nice time sync and low drift!minpoll 1 maxpoll 1seems to provide the best responsiveness and stability. iburst means that chrony will try to synchronize to the time servers very fast at the beginning, but will not follow a scheduled polling rate if it is not set after startup. -
Modify the
makestepline to allow Chrony to update the clock on any clock cycle, instead of just the first 3 clock cycles. Also, change makestep so it adjusts every 100msec instead of 1 secondmakestep 0.1 -1.
Without these modifications, you will only be well synchronized at the start of the chronyc service:
- Update
maxupdateskewfrom100to5or10(TBD which is best)
Here is my complete modified config file. For my server, Google's NTP time server had the best latency. You may try to find other servers that provide better latency.
pool time.google.com       iburst minpoll 1 maxpoll 1 maxsources 3
# pool ntp.ubuntu.com        iburst maxsources 3
# pool time.nist.giv         iburst maxsources 3
# pool us.pool.ntp.org       iburst maxsources 3

# This directive specify the location of the file containing ID/key pairs for
# NTP authentication.
keyfile /etc/chrony/chrony.keys

# This directive specify the file into which chronyd will store the rate
# information.
driftfile /var/lib/chrony/chrony.drift

# Uncomment the following line to turn logging on.
#log tracking measurements statistics

# Log files location.
logdir /var/log/chrony

# Stop bad estimates upsetting machine clock.
maxupdateskew 5.0

# This directive enables kernel synchronisation (every 11 minutes) of the
# real-time clock. Note that it can’t be used along with the 'rtcfile' directive.
rtcsync

# Step the system clock instead of slewing it if the adjustment is larger than
# one second, but only in the first three clock updates.
makestep 0.1 -1
After saving and modifying the config file, make sure to restart the chronyd daemon so it picks up the config changes!
sudo systemctl restart chronyd
Finally, you may monitor the differences in the outputs of chronyc tracking to see how we have affected our system clock. But...this is not the best way of visualizing the change in time synchronized drift...thats where Grafana comes into play:
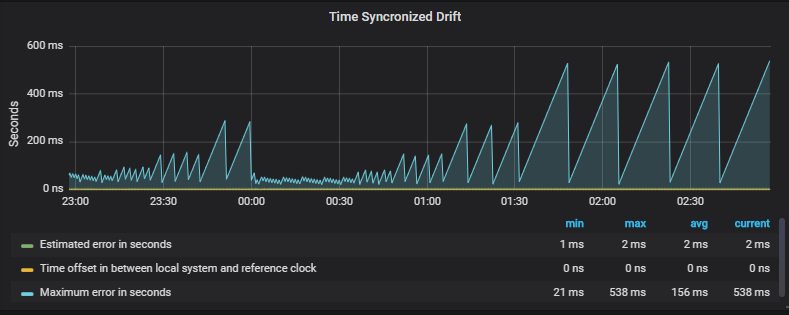
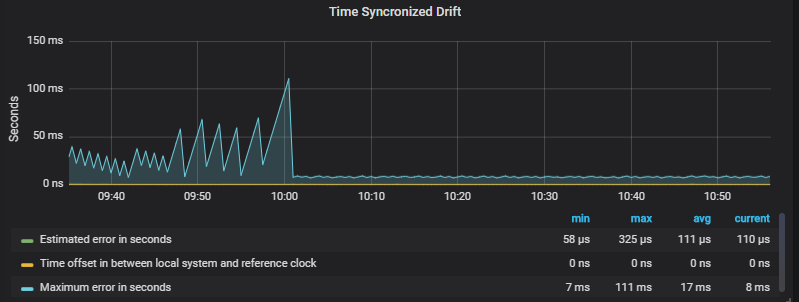
Before tuning experiments:
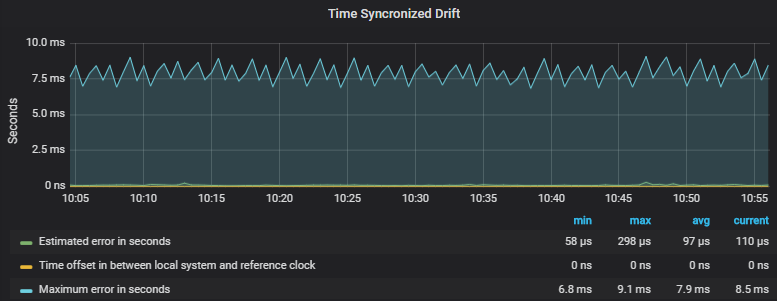
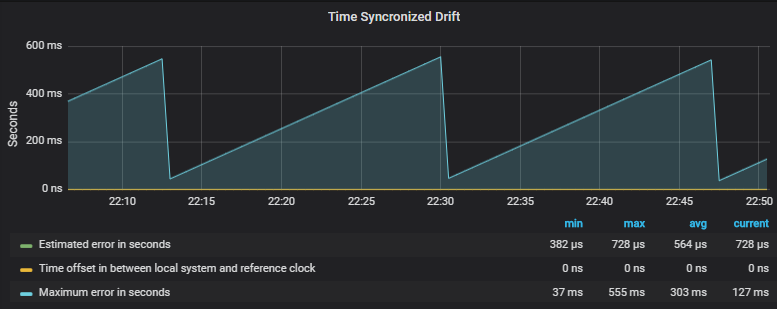 After applying above config with
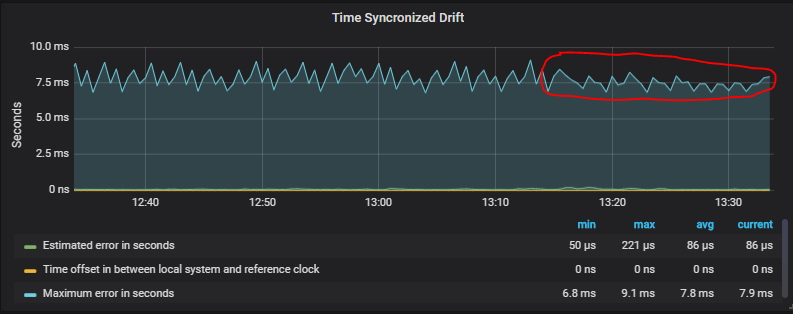
 1/1 min/max step:
- Jormungandr (v0.8.5 is the latest as of last article edit) (accessible globally in your $PATH)
- JCLI (accessible globally in your $PATH)
- Prometheus (https://prometheus.io/download/)
- Prometheus Node Exporter (download form above link, search node exporter)
- Grafana (https://grafana.com/grafana/download)
- Download the monitoring repo from the IOHK jormungandr-nix repo: https://github.com/input-output-hk/jormungandr-nix/tree/master/nixos/jormungandr-monitor
- Chrony (sudo apt-get install chrony)
For Prometheus, Prometheus Node Exporter, and Grafana, just wget the tar files from the links from above in your terminal, extract and run the binarys to start each server.
You may also consider using @ilap's easy setup script that installs Prometheus, Grafana, and the Jormungandr data sources for you automatically. All you will need to do is install the Node Exporter data source after that to get time synchronized drift data. https://gist.github.com/ilap/930b1869ff32f79db1c3d4da2ebd96aa
For now, please watch this excellent straightforward youtube video for a great tutorial on how to install Prometheus, Grafana, and Node Exporter: https://www.youtube.com/watch?v=4WWW2ZLEg74
Note - you do not need to install the jormungandr datasource to tune your time synchronized drift. You may ignore all jormungandr related information if all you want to do is experiment with time drift. Adding the jormungandr datasource allows you to also monitor and log your node stats, such as uptime and block height, into a time series database for review in the future.
-
Extract and run all the binaries from the download links above. Before running, edit the configs as instructed in the video and below:
-
Your Prometheus YAML config file needs to include the following for the new "jormungandr" datasource, as well as the "node exporter" data source
  - job_name: 'node_exporter'
    static_configs:
    - targets: ['localhost:9100']
  - job_name: 'jormungandr'
    static_configs:
    - targets: ['localhost:8000']
-
Change your Grafana or Jormungandr from port 3000. They both use port 3000 as default.
-
If you are running this on a server w/ terminal only access, you will need to SSH tunnel into your server's web server ports in order to access the grafana webpage on your local machine:
ssh -N -L PORT2TUNNEL:127.0.0.1:PORT2TUNNEL root@serveripaddress

Example for grafana (port 3000 is default, change to 3001 so it doesnt collide with Jormungandr default port)
ssh -N -L 3001:127.0.0.1:3001 root@serveripaddress
Ports:
3001 Grafana
9090 Prometheus
9100 Node Exporter
8000 Jormungandr Exporter
You can now enter 127.0.0.1:port to access these web servers from your local web browser.
-
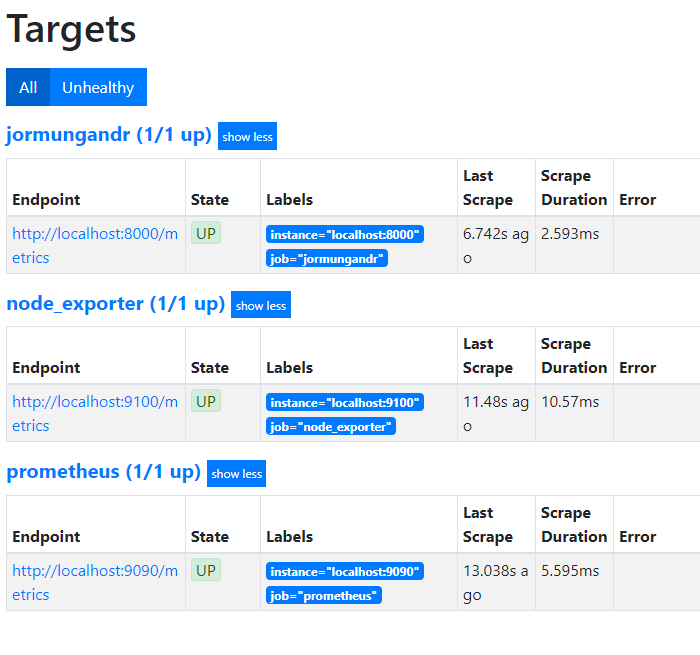
Make sure you can see your jormungandr job and node_exporter job "Targets" in the Prometheus dashboard (port 9090), under Status->Targets. It may take 15 seconds to appear upon starting Prometheus, as that is the default "scrape rate" for data collection.
-
The Prometheus Node Exporter is the service that provides the "Time Synchronized Drift" data.
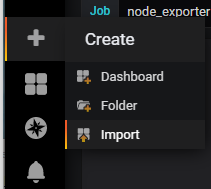
You can find import the Grafana dashboard that has this graph for Node Exporter by importing this into Grafana: https://grafana.com/grafana/dashboards/1860
-
Add the node_exporter and jormungandr datasource in Grafana.
-
Import the dashboard above:
-
Load the dashboard and find the Time Synchronized Drift buried within all the cool datasets.
-
Allow the data to build for some time, and then make the change to your chrony configuration file.
-
Note the differences in time synchronized drift after making the Chrony changes. Rinse and repeat for excellent graphical tuning.
systemctl restart chronyd
The results are excellent!!
We are now stable at 7.5ms with a nice even synchronization period!
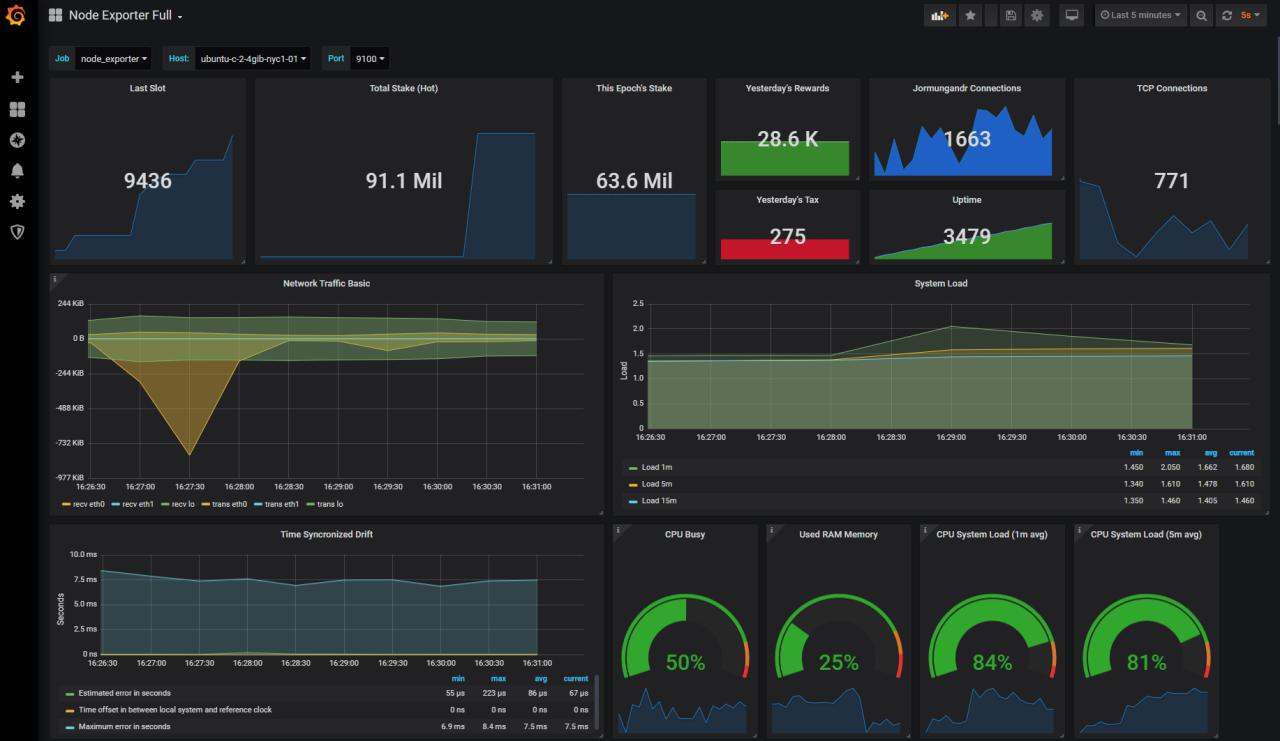
In the future, I plan to add some more information about Grafana and Prometheus in this document. It can be pretty powerful to get a 1000 foot view of overall system performance. Here is a dashboard I came up with that includes both Jormungandr and Node Exporter data source data:
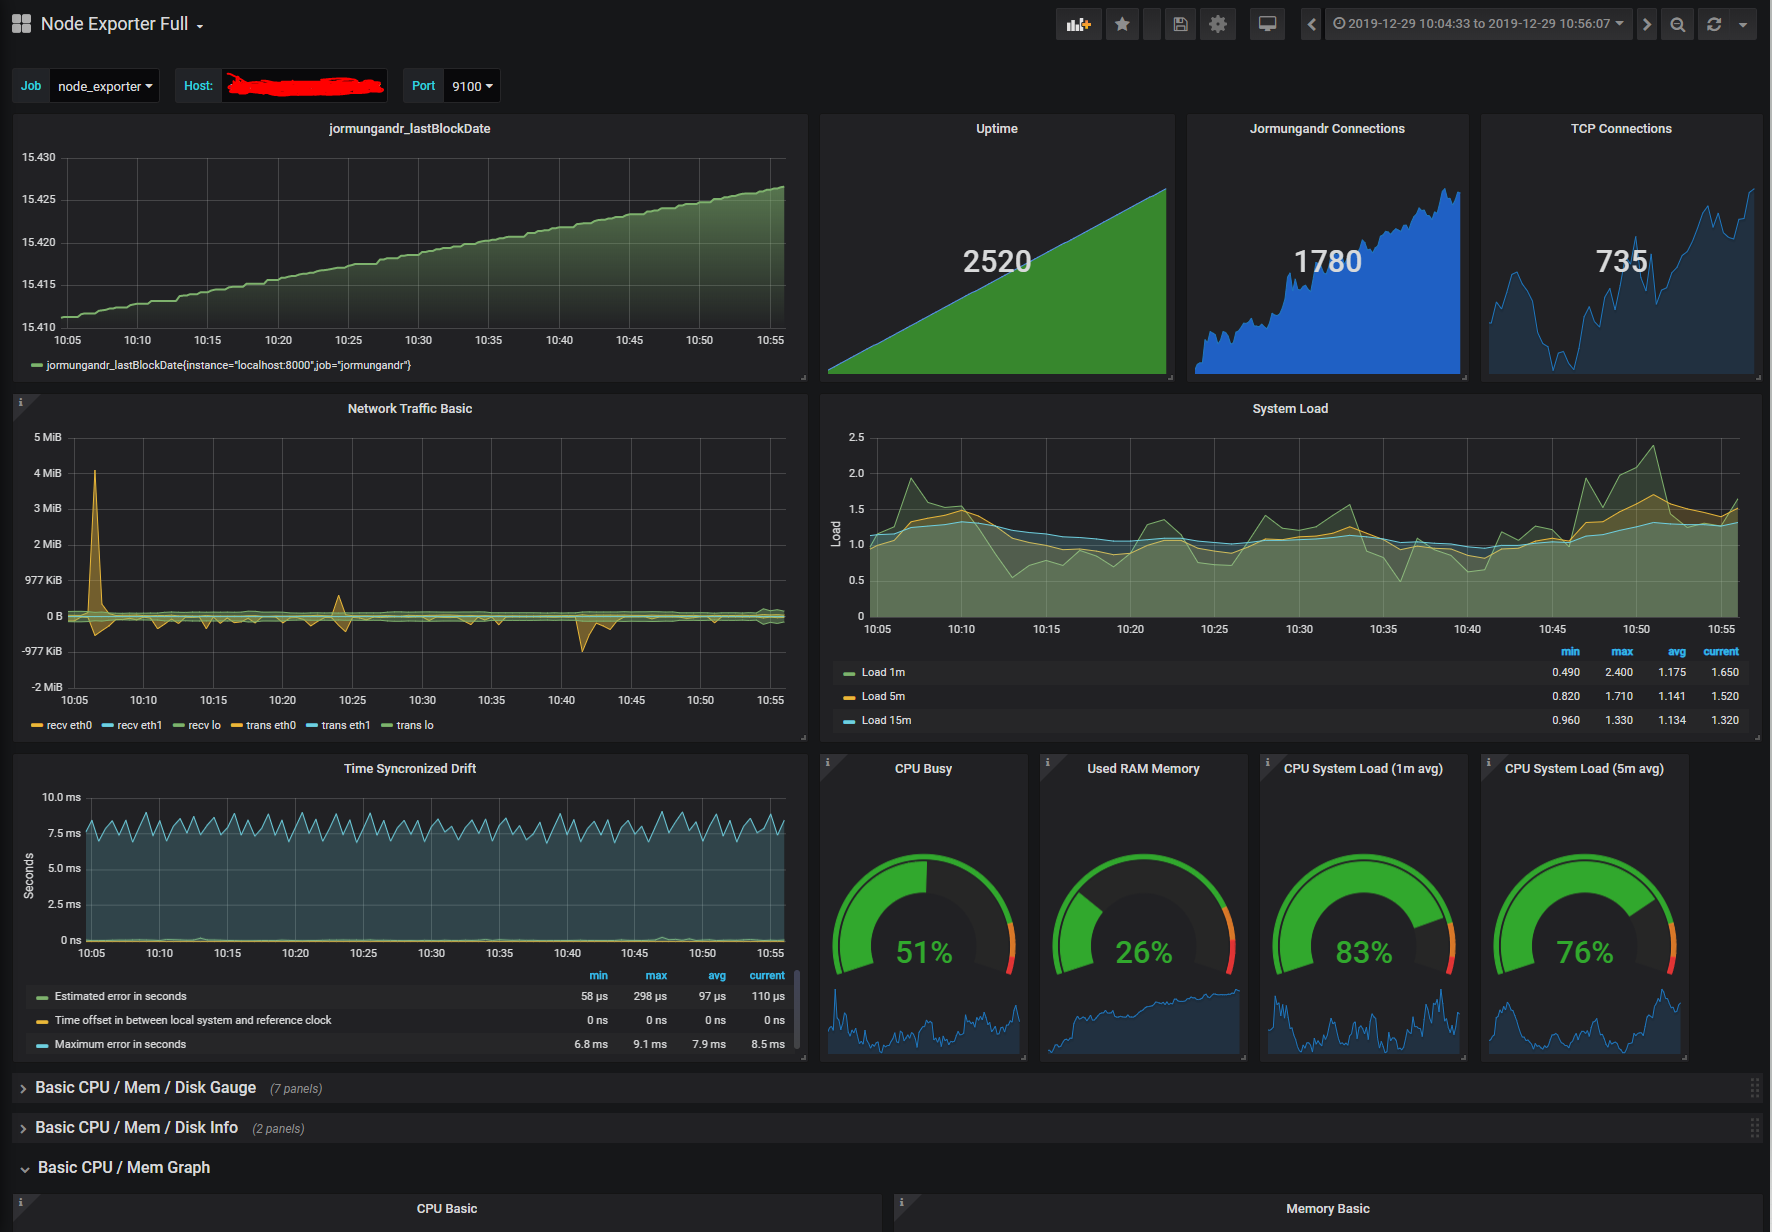
This modified script allows you to also grab your stake pool stats to start tracking your history, such as rewards earned, fees earned, value staked to you, etc... Prometheus will automatically track this information for you in a time series database as long as you have it running in the background. The stakepool ID for LVLY is currently hard coded into the python code, so please change to your ID to grab your information.
https://github.com/lovelypool/cardano_stuff/blob/master/monitor.py
If you want to use this dashboard for yourself, please make sure you have all the prerequisites talked about above. You can import this JSON file to use the theme that I put together:
https://github.com/lovelypool/cardano_stuff/blob/master/cardanodash.json