OracleDB mixin is a set of configurable alerts and dashboards that use the third party OracleDB Exporter using Prometheus and Loki for logs (optional).
| Alert | Description | Default Threshold |
|---|---|---|
| OracledbReachingSessionLimit | number of processess being utilized exceeded a theshold. | 85% |
| OracledbReachingProcessLimit | The number of processess being utilized exceeded the threshold. | 85% |
| OracledbTablespaceReachingCapacity | A Tablespace is exceeded its threshold of its maximum allotted space. | 85% |
Default thresholds can be configured in config.libsonnet.
{
  _config+:: {
    alertsSessionThreshold: '85',  // %
    alertsProcessThreshold: '85',  // %
    alertsTablespaceThreshold: '85',  // %
  },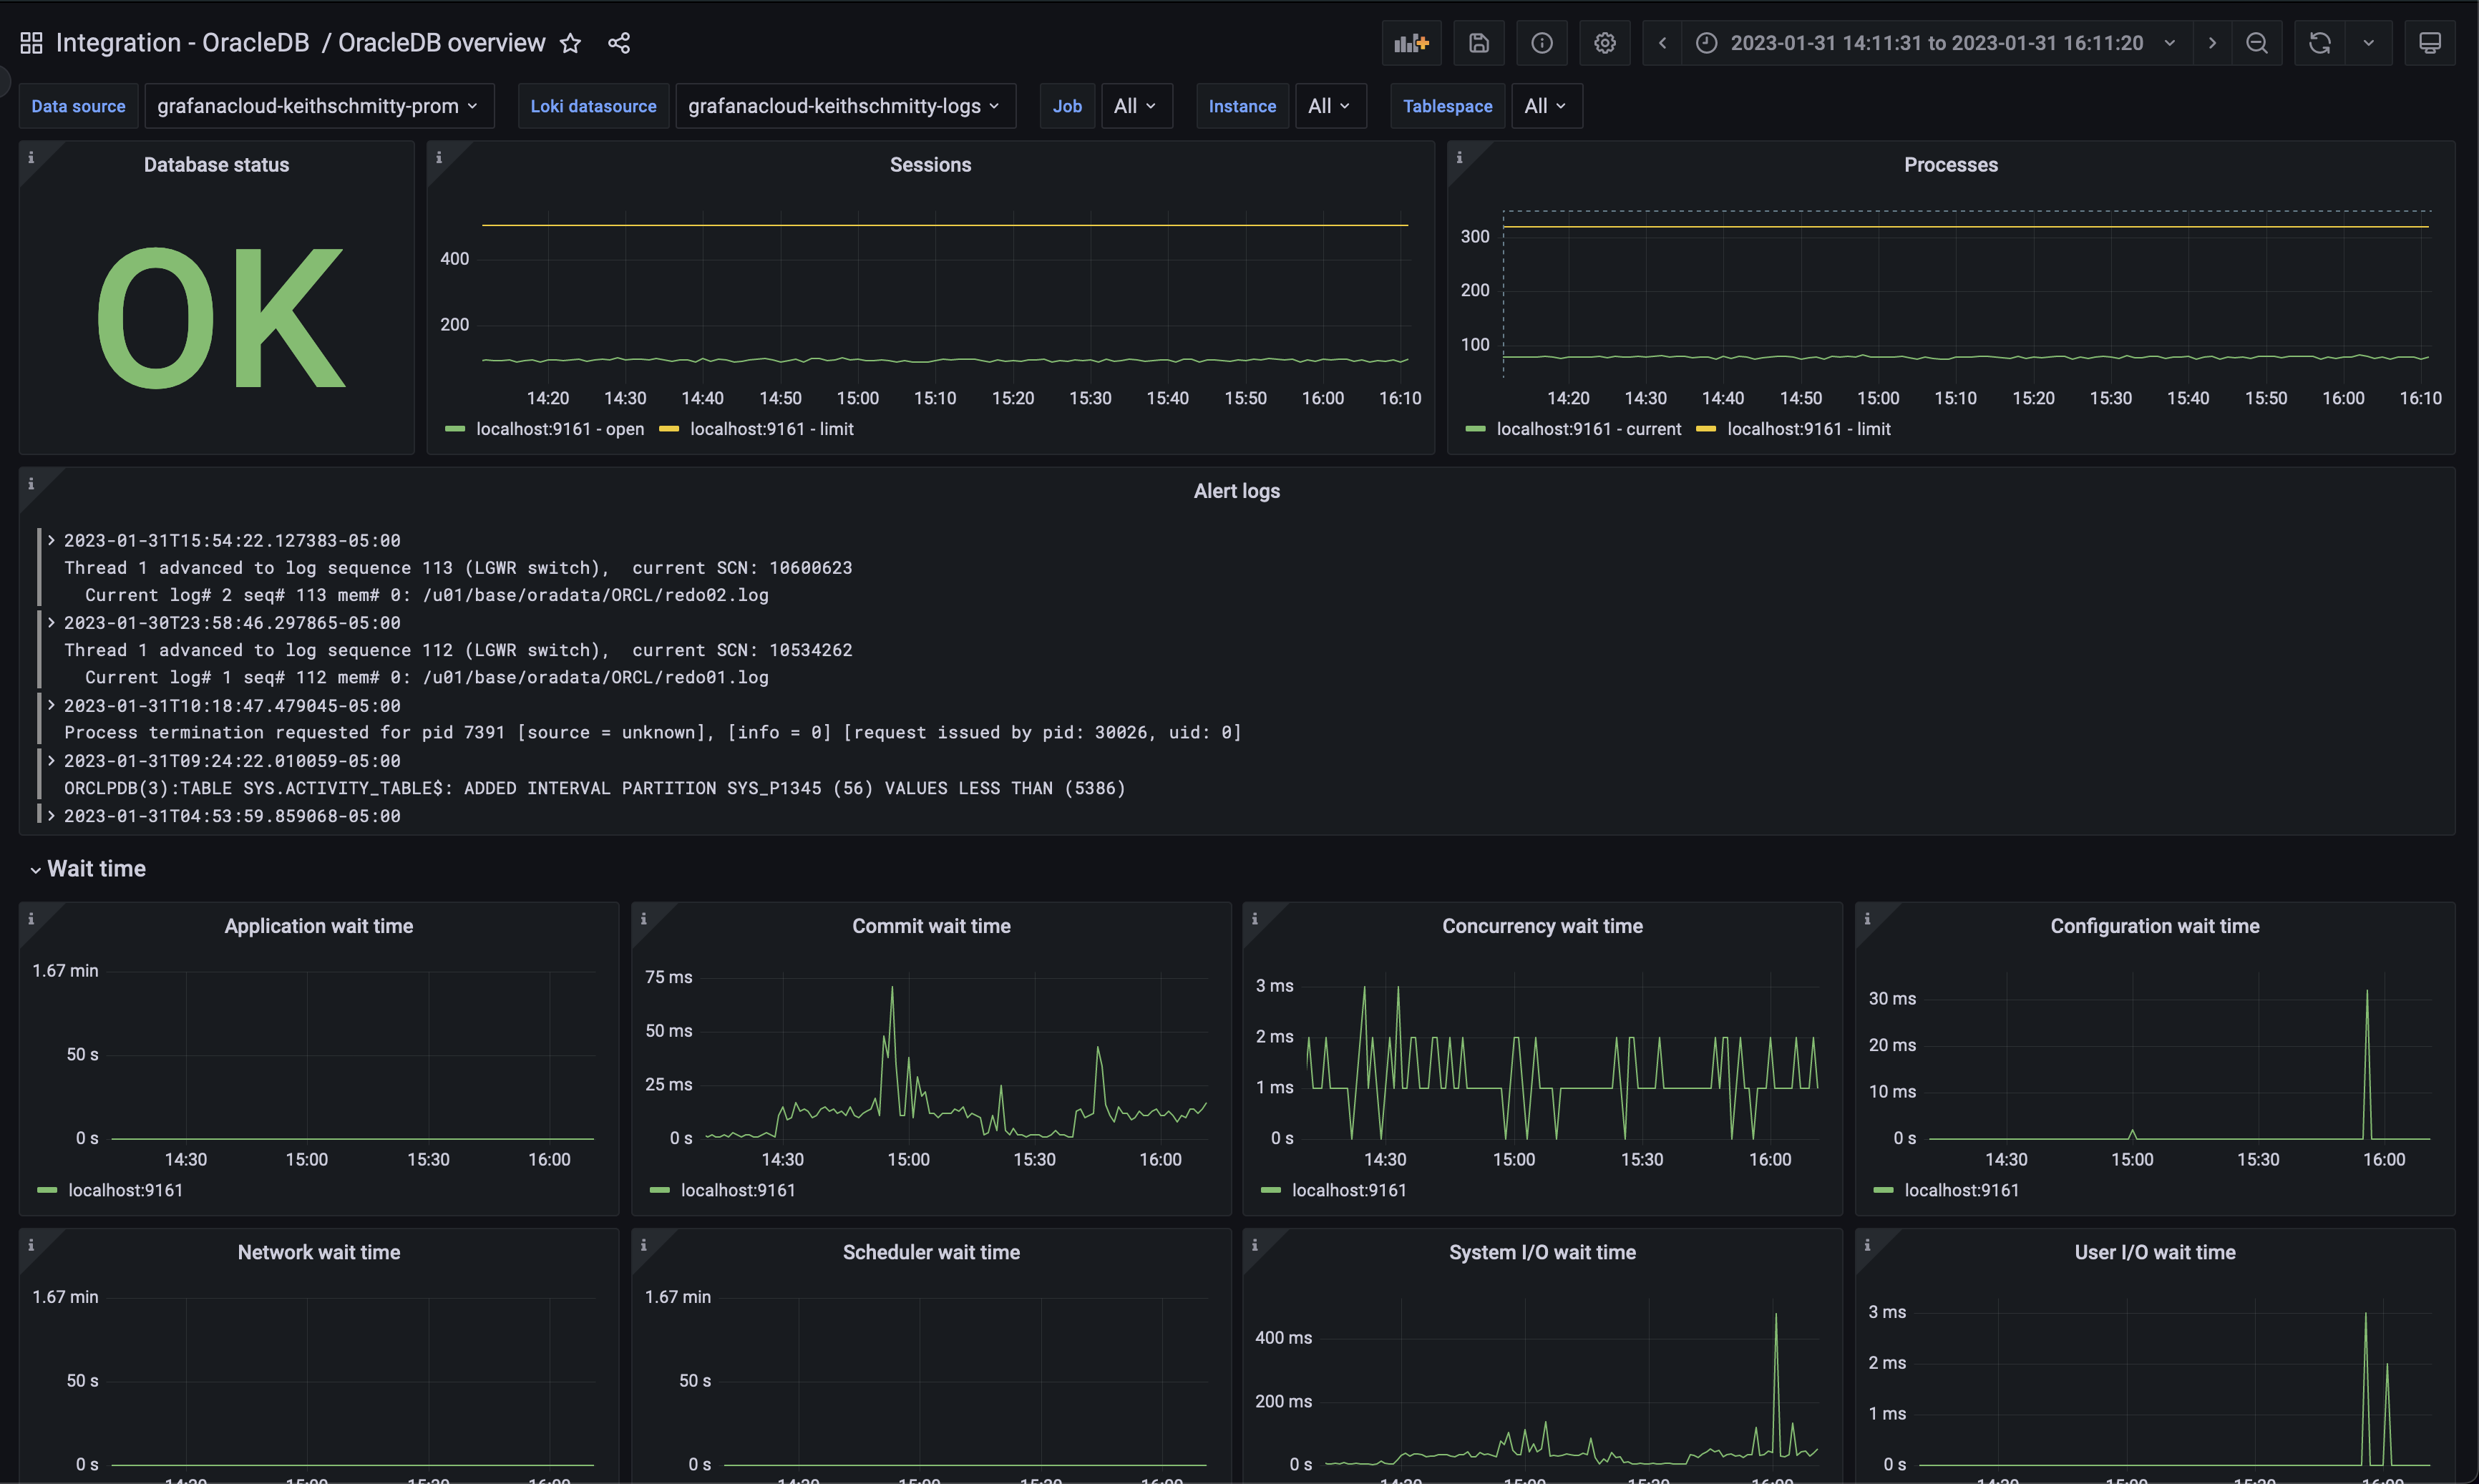
}This mixin includes one dashboard: OracleDB Overview which includes a variety of metrics and a panel for alert logs.
OracleDB alert logs are enabled by default in the config.libsonnet and can be remoed by setting enableLokiLogs to false and generating the dashboards again.
{
  _config+:: {
    enableLokiLogs: true,
  },
}
Alert logs are generally located at $ORACLE_HOME/diag/rdbms/*/*/trace/alert_*.log but please follow the official documentation to determine the location specific to respective installs.
go install github.com/jsonnet-bundler/jsonnet-bundler/cmd/jb@latest
go install github.com/monitoring-mixins/mixtool/cmd/mixtool@latest
For linting and formatting, you would also need and jsonnetfmt installed. If you
have a working Go development environment, it's easiest to run the following:
go install github.com/google/go-jsonnet/cmd/jsonnetfmt@latestThe files in dashboards_out need to be imported
into your Grafana server. The exact details will be depending on your environment.
prometheus_alerts.yaml needs to be imported into Prometheus.
Edit config.libsonnet if required and then build JSON dashboard files for Grafana:
makeFor more advanced uses of mixins, see https://github.com/monitoring-mixins/docs.