The Microsoft SQL Server mixin is a set of configurable Grafana dashboards and alerts based on the Grafana Agent mssql integration.
The Microsoft SQL Server mixin contains the following dashboards:
- MSSQL overview
- MSSQL pages
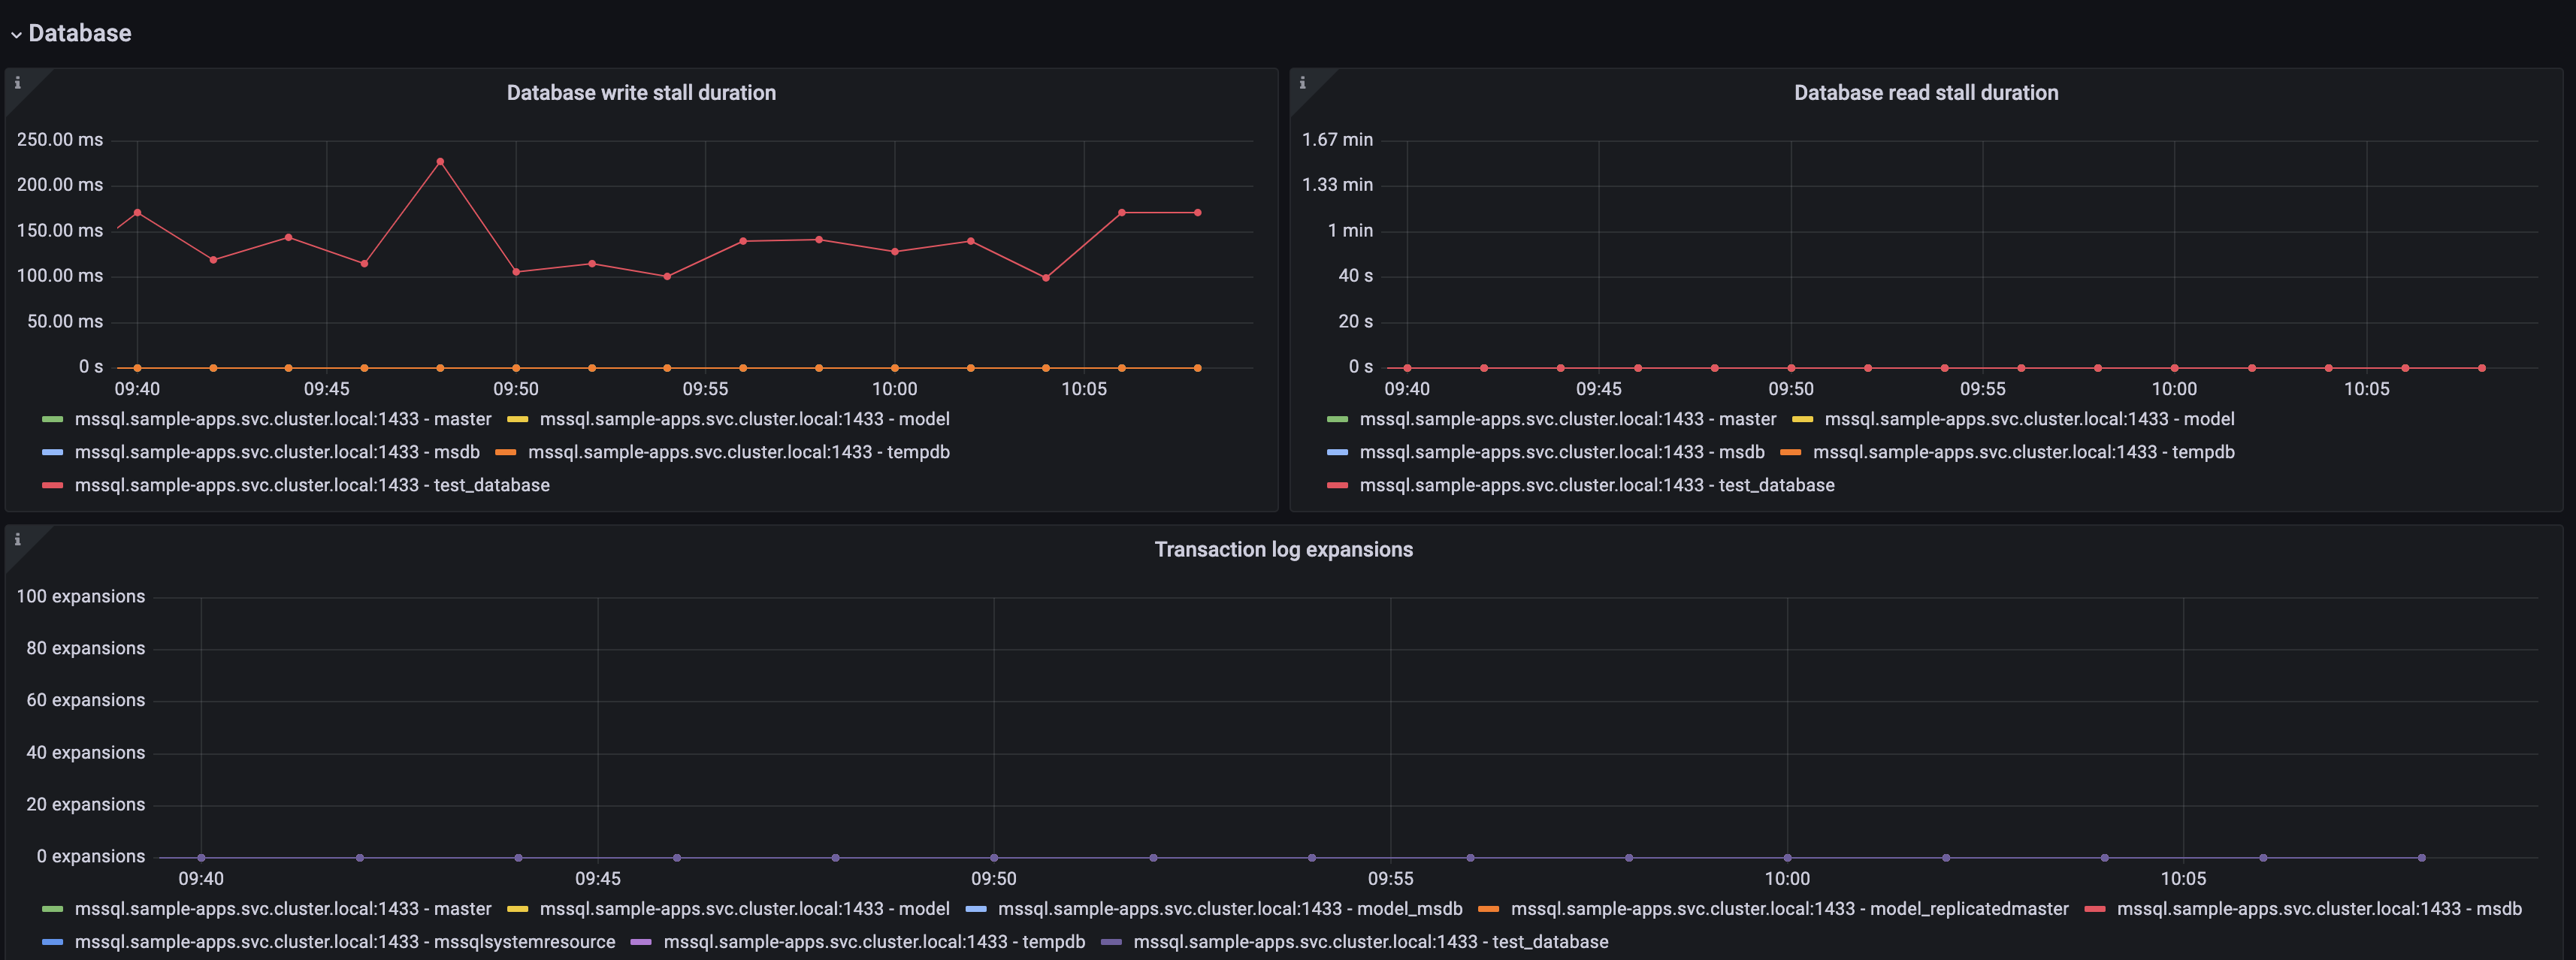
The MSSQL overview dashboard provides details on traffic, errors, memory usage, IO performance, and error logs. To get MSSQL error logs, Promtail and Loki needs to be installed and provisioned for logs with your Grafana instance. The default MSSQL error log path is /var/opt/mssql/log/errorlog on Linux, and C:\Program Files\Microsoft SQL Server\MSSQL.*\MSSQL\LOG\ERRORLOG on Windows. In order to show up in the dashboard, the logs must have a log_type label of mssql_error.

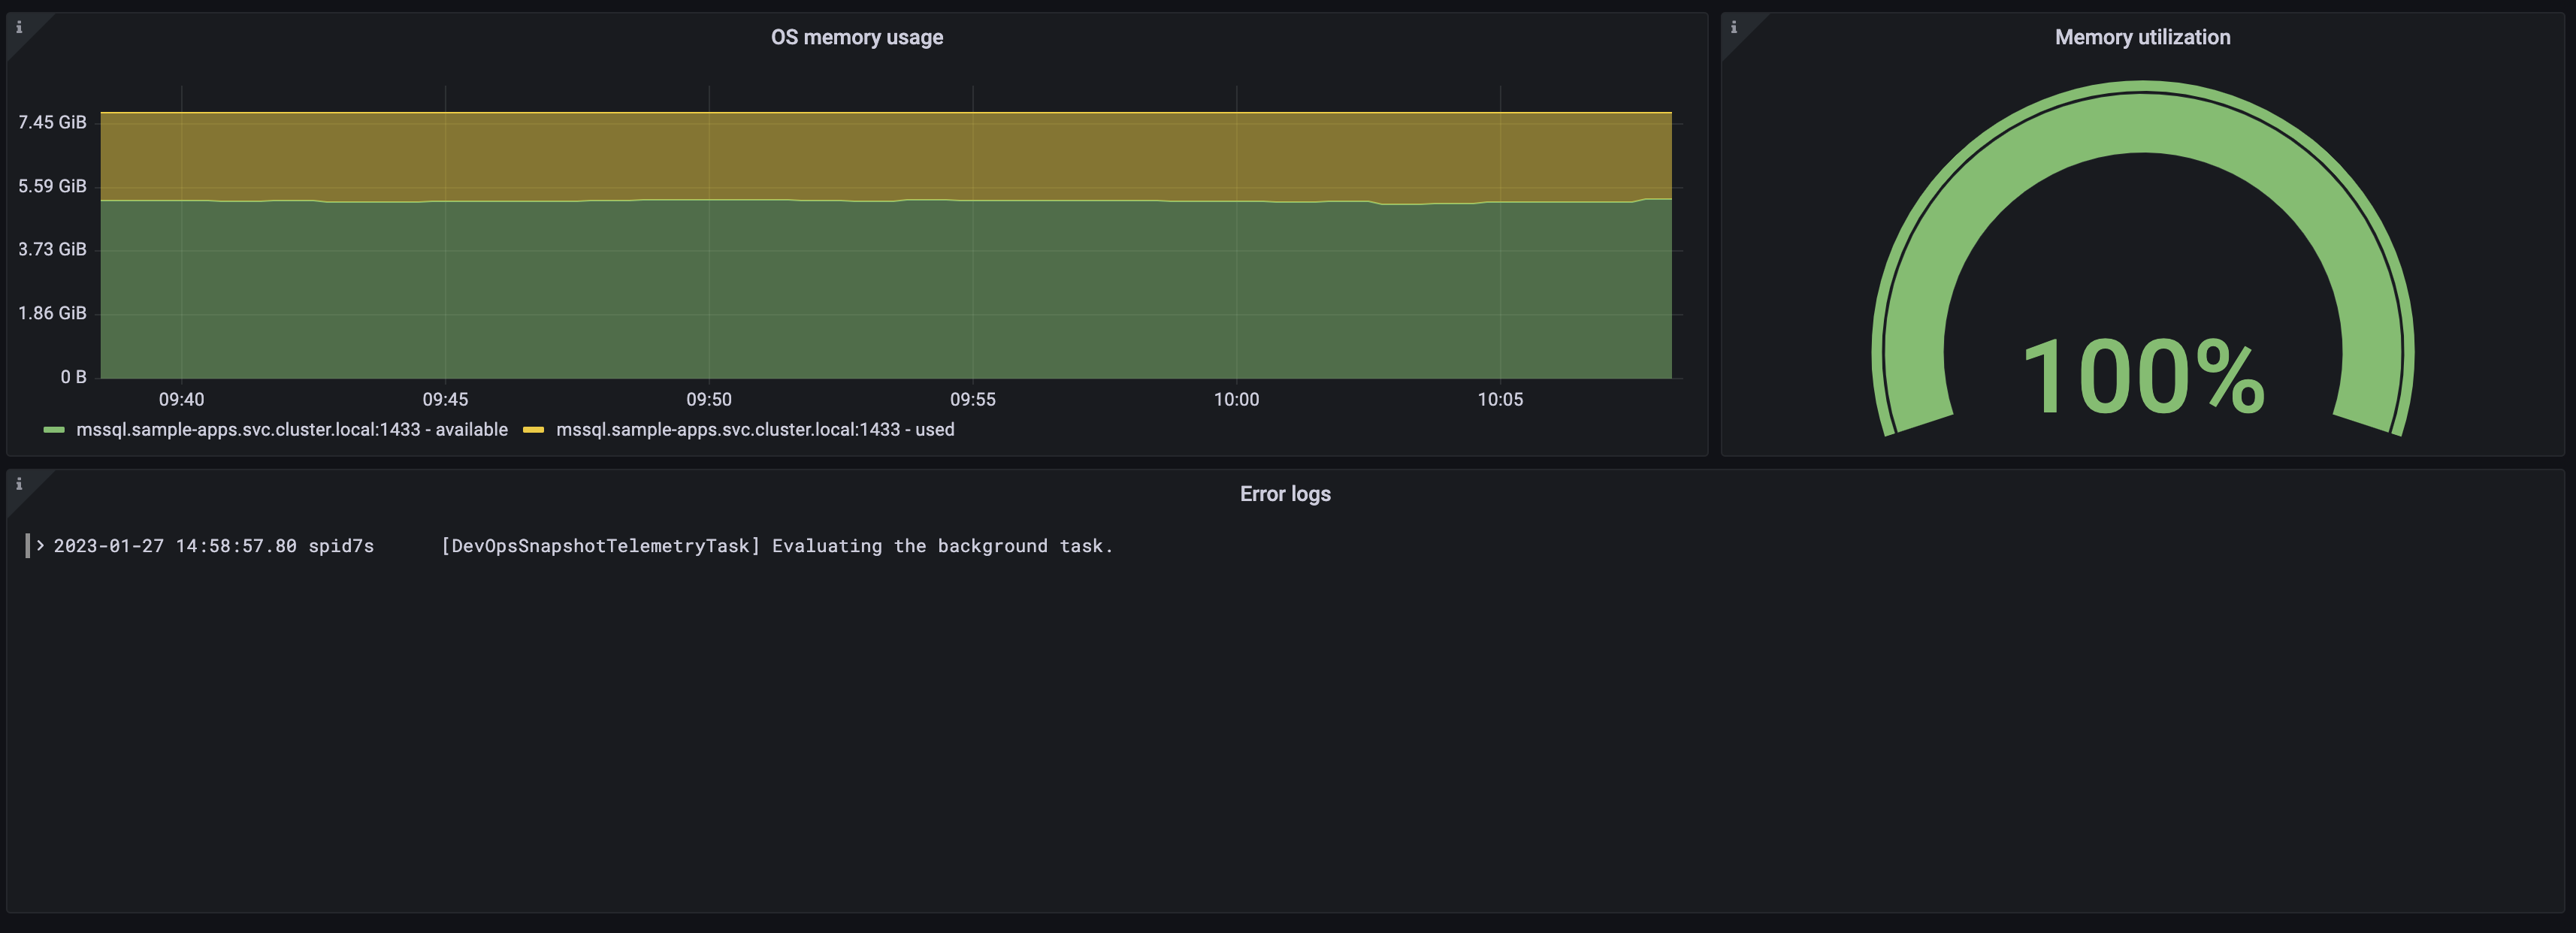
MSSQL error logs are enabled by default in the config.libsonnet and can be removed by setting enableLokiLogs to false. Then run make again to regenerate the dashboard:
{
  _config+:: {
    enableLokiLogs: false,
  },
}
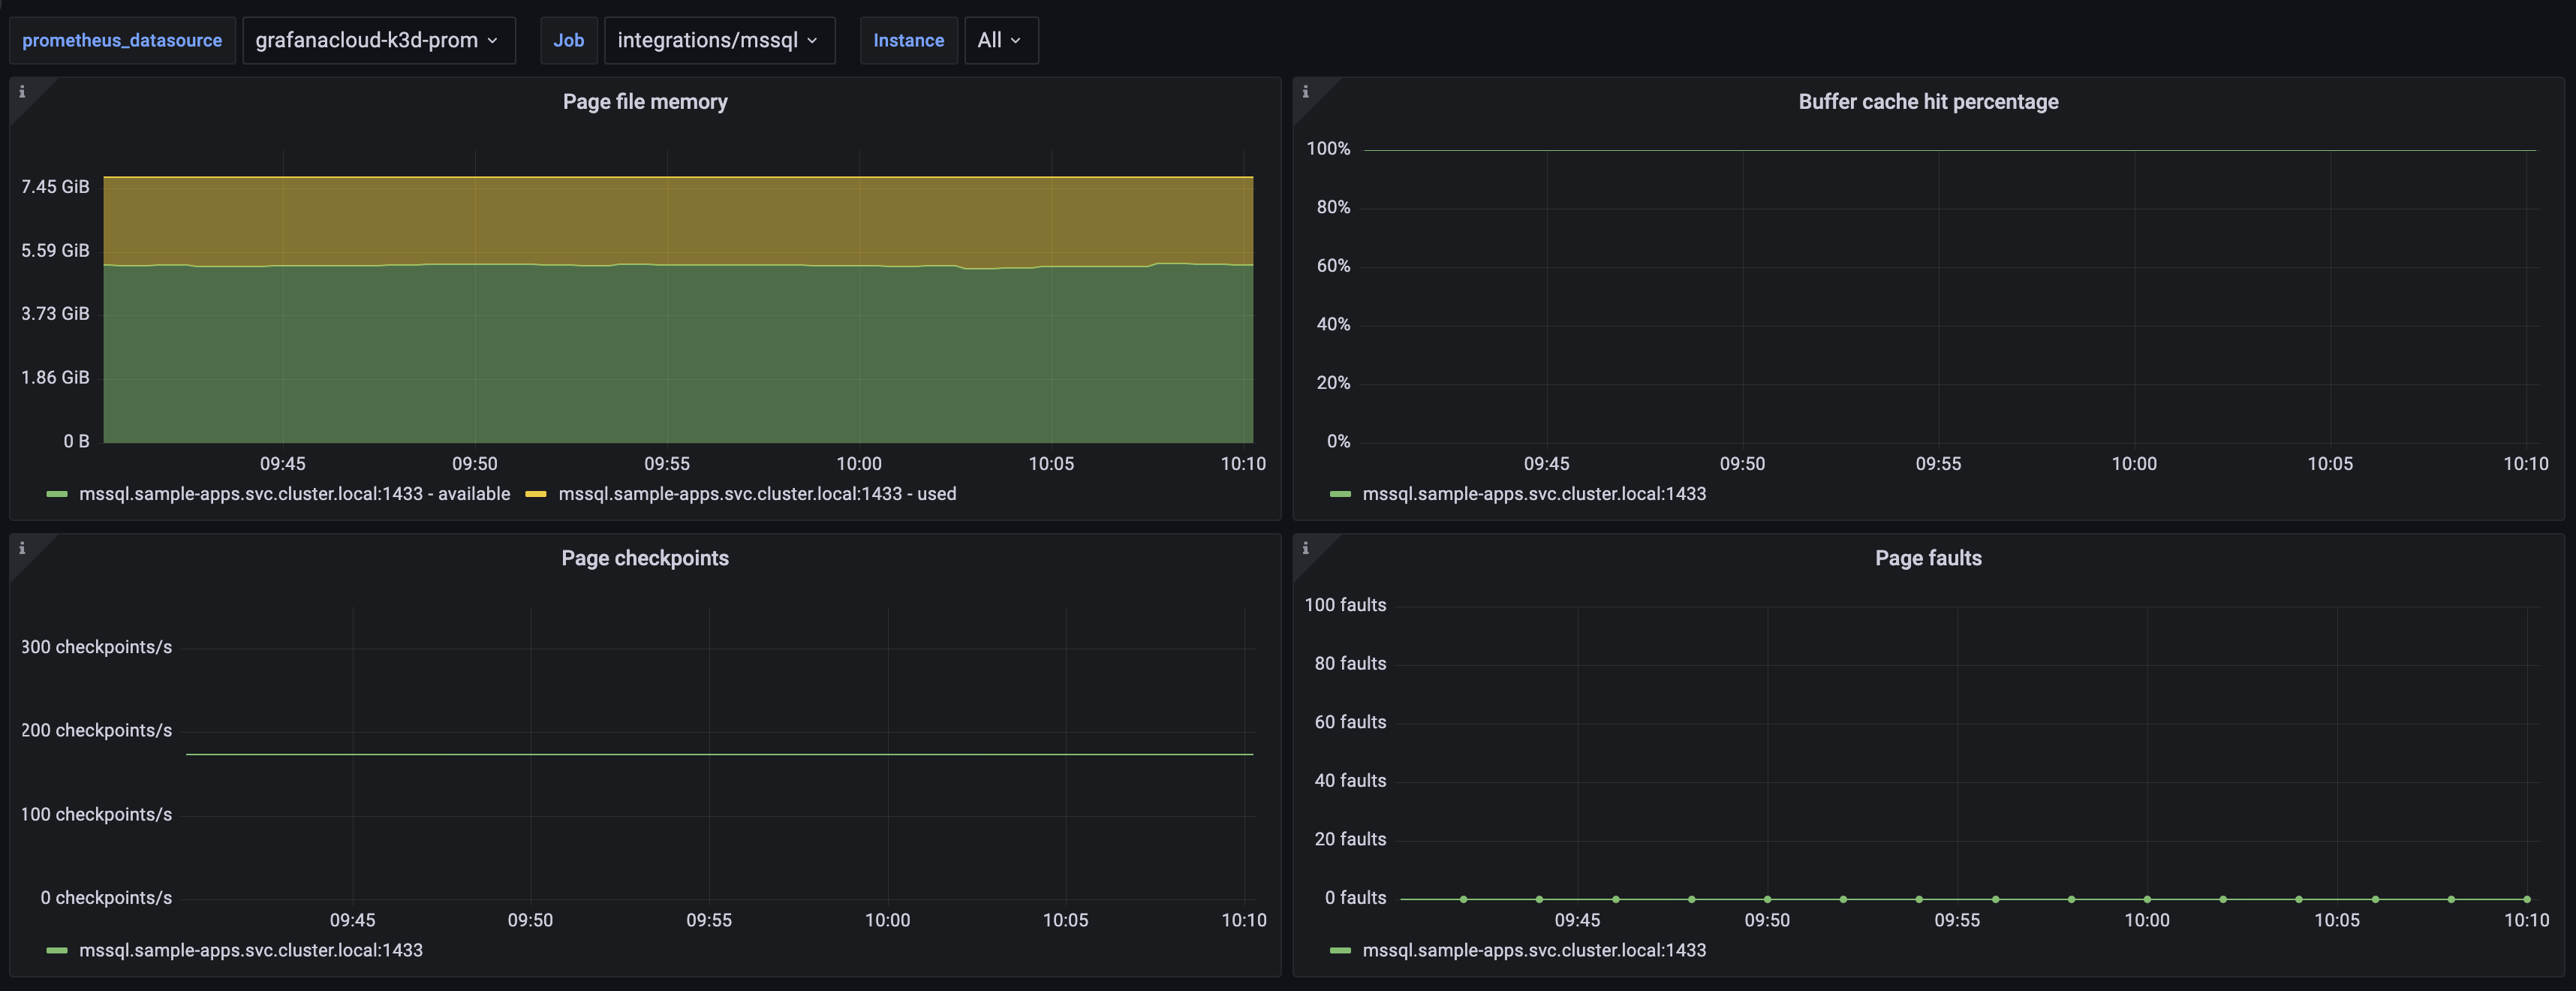
The MSSQL pages dashboard provides details on page file usage and performance.
go install github.com/jsonnet-bundler/jsonnet-bundler/cmd/jb@latest
go install github.com/monitoring-mixins/mixtool/cmd/mixtool@latest
For linting and formatting, you would also need and jsonnetfmt installed. If you
have a working Go development environment, it's easiest to run the following:
go install github.com/google/go-jsonnet/cmd/jsonnetfmt@latestThe files in dashboards_out need to be imported
into your Grafana server. The exact details will be depending on your environment.
prometheus_alerts.yaml needs to be imported into Prometheus.
Edit config.libsonnet if required and then build JSON dashboard files for Grafana:
makeFor more advanced uses of mixins, see https://github.com/monitoring-mixins/docs.