Example:
n = 1000
np.random.seed(42)
data = {
    "x": np.random.choice(["a", "b", "c"], p=[.49, .49, .02], size=n),
    "g": np.random.choice(["X", "Y"], size=n),
}
ggplot(data, aes(x="x", fill="g")) + geom_bar() + scale_y_continuous(trans='log10')
Output:
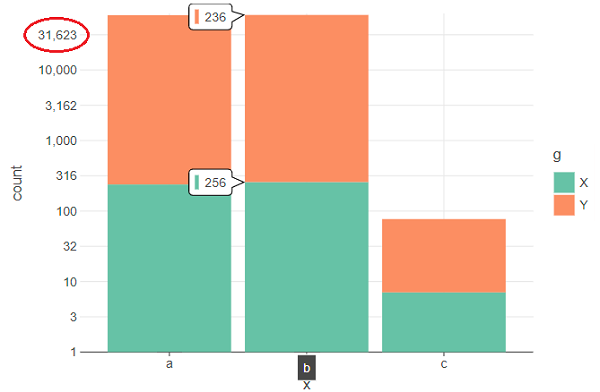
Label values on y axis are much greater than expected. There is no such trouble if fill="g" or trans='log10' will be removed.
Example:
Output:
Label values on
yaxis are much greater than expected. There is no such trouble iffill="g"ortrans='log10'will be removed.