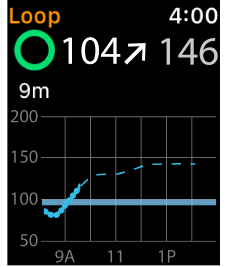
I appreciate the convenience of being able to glance down at my watch to know what my blood sugar is and where it will eventually end up. I would find it helpful to see the shape of the curve between now and BG(eventual). Is my blood sugar going to rise and then drop down to BG(eventual); drop and then rise up to BG(eventual); or almost immediately go roughly to BG(eventual) and then remain there steadily.
Putting a graph in Loop on the Apple Watch would help differentiate different scenarios in a glance. Below is a mock version of what this would look like as well as the data on the phone which is what I used for the mock-up.