I'm trying to debug STM32F4 hardware with freeRTOS using J-link, but after succesfull launch and run, debug totally hangs when it hits one of breakpoints (hardware or __asm__("BKPT")). All action buttons (reset, pause and restart) became unresponsive (I can press them and even see command in debug console, but nothing else).
Before reaching breakpoint everything works fine (I can run and pause, do step-by-step debugging and everything else), but when breakpoint is reached everything hangs. If I close and launch debug session again - I can see that execution stopped at my breakpoint.
GDB -> App: {"output":"","outOfBandRecord":[{"isStream":false,"type":"notify","asyncClass":"thread-created","output":[["id","3"],["group-id","i1"]]}]}
GDB -> App: {"output":"","outOfBandRecord":[{"isStream":true,"type":"console","content":"[New Thread 268445668]\n"}]}
[New Thread 268445668]
GDB -> App: {"output":"","outOfBandRecord":[{"isStream":false,"type":"notify","asyncClass":"breakpoint-modified","output":[["bkpt",[["number","1"],["type","breakpoint"],["disp","keep"],["enabled","y"],["addr","0x080c38b8"],["func","main_loop_task"],["file","[/some_source.c]()"],["fullname","[/some_source.c]()"],["line","247"],["thread-groups",["i1"]],["times","1"],["original-location","[/some_source.c:247]()"]]]]}]}
GDB -> App: {"output":"","outOfBandRecord":[{"isStream":false,"type":"notify","asyncClass":"thread-exited","output":[["id","3"],["group-id","i1"]]}]}
GDB -> App: {"output":"","outOfBandRecord":[{"isStream":false,"type":"notify","asyncClass":"thread-created","output":[["id","4"],["group-id","i1"]]}]}
GDB -> App: {"output":"","outOfBandRecord":[{"isStream":true,"type":"console","content":"[New Thread 4748040]\n"}]}
[New Thread 4748040]
GDB -> App: {"output":"","outOfBandRecord":[{"isStream":true,"type":"console","content":"[Switching to Thread 268445668]\n"}]}
[Switching to Thread 268445668]
94-exec-interrupt
GDB -> App: {"output":"","token":94,"outOfBandRecord":[],"resultRecords":{"resultClass":"done","results":[]}}
I'm trying to debug STM32F4 hardware with freeRTOS using J-link, but after succesfull launch and run, debug totally hangs when it hits one of breakpoints (hardware or
__asm__("BKPT")). All action buttons (reset, pause and restart) became unresponsive (I can press them and even see command in debug console, but nothing else).Before reaching breakpoint everything works fine (I can run and pause, do step-by-step debugging and everything else), but when breakpoint is reached everything hangs. If I close and launch debug session again - I can see that execution stopped at my breakpoint.
launch.json
{
"version": "0.2.0",
    "configurations": [
        {
            "name": "Jlink",
            "cwd": "${workspaceRoot}",
            "executable": "${workspaceRoot}/build/first_part.elf",
            "request": "attach",
            "type": "cortex-debug",
            "servertype": "jlink",
            "svdFile": "${workspaceRoot}/STM32F407.svd",
            "interface": "swd",
            "device": "STM32F407VG",
            "armToolchainPath": "/home/saloid/Documents/Projects/tools/gcc-arm-none-eabi-10.3-2021.10/bin",
            "showDevDebugOutput": true,
            "preAttachCommands": [
                "set substitute-path /tmp/opentx ${workspaceRoot}/new_sources_path",
                "add-symbol-file ${workspaceRoot}/build/another_part.elf 0x080c0080",
            ],
            "rtos": "FreeRTOS",
            "moduleLoad": true,
        }
    ]
}
When brekpoint is reached (and debug hangs) I can see this in debug console:
And buttons are still in "Running state" (but really device is stopped)
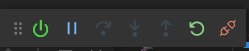
When I push any button (reset, pause or restart) this appears in debug console:
Cortex-debug 1.4.4