-
-
Notifications
You must be signed in to change notification settings - Fork 1.1k
docs: update tracing #979
New issue
Have a question about this project? Sign up for a free GitHub account to open an issue and contact its maintainers and the community.
By clicking “Sign up for GitHub”, you agree to our terms of service and privacy statement. We’ll occasionally send you account related emails.
Already on GitHub? Sign in to your account
Merged
Merged
docs: update tracing #979
Changes from all commits
Commits
Show all changes
6 commits
Select commit
Hold shift + click to select a range
7f9340a
feat: update observability documentation with new user and views sect…
necatiozmen 86ba175
feat: enhance observability documentation with improved clarity and s…
necatiozmen 3caae0e
chore: typo fix
omeraplak ce46b4b
feat: add observability documentation for tracing, including new view…
necatiozmen 9ecde9a
Merge branch 'update-observability-docs' of https://github.com/VoltAg…
necatiozmen 2178fae
fix: update headings in user analytics documentation for consistency
necatiozmen File filter
Filter by extension
Conversations
Failed to load comments.
Loading
Jump to
Jump to file
Failed to load files.
Loading
Diff view
Diff view
There are no files selected for viewing
This file was deleted.
Oops, something went wrong.
This file contains hidden or bidirectional Unicode text that may be interpreted or compiled differently than what appears below. To review, open the file in an editor that reveals hidden Unicode characters.
Learn more about bidirectional Unicode characters
| Original file line number | Diff line number | Diff line change |
|---|---|---|
| @@ -0,0 +1,23 @@ | ||
| --- | ||
| title: Trace Feedback | ||
| --- | ||
|
|
||
| import MediaPanel from "@site/src/components/docs-widgets/MediaPanel"; | ||
|
|
||
| # Trace Feedback | ||
|
|
||
| Use Feedback to tie human judgment to a specific trace so you can validate fixes and catch regressions early. It turns "this felt wrong" into a trackable signal you can compare across runs. | ||
|
|
||
| What to look at: | ||
|
|
||
| - **History and source**: confirm the trace was rated and where it came from (app, API, model). | ||
| - **Key and score**: keep signals consistent (for example, satisfaction) so you can compare runs. | ||
| - **Comments**: capture short context that explains why the output was good or bad. | ||
|
|
||
| <MediaPanel | ||
| src="https://cdn.voltagent.dev/docs/observability/tracing/feedback.gif" | ||
| alt="Trace feedback" | ||
| width={520} | ||
| /> | ||
|
|
||
| <br/> |
This file contains hidden or bidirectional Unicode text that may be interpreted or compiled differently than what appears below. To review, open the file in an editor that reveals hidden Unicode characters.
Learn more about bidirectional Unicode characters
| Original file line number | Diff line number | Diff line change |
|---|---|---|
| @@ -0,0 +1,18 @@ | ||
| --- | ||
| title: Trace Logs | ||
| --- | ||
|
|
||
| # Trace Logs | ||
|
|
||
| Use Logs to review structured events tied to the trace and span context. This is the fastest way to inspect errors and metadata without opening each span. | ||
|
|
||
| <video controls loop muted playsInline style={{width: '100%', height: 'auto'}}> | ||
|
|
||
| <source src="https://cdn.voltagent.dev/docs/observability/tracing/logs-2.mp4" type="video/mp4" /> | ||
| Your browser does not support the video tag. | ||
| </video> | ||
|
|
||
| <br/> | ||
| <br/> | ||
|
|
||
| Logs are best when you need a fast answer to "what happened and why." Start with errors, then use search or level filters to narrow down, and follow the trace/span context to the exact step. |
This file contains hidden or bidirectional Unicode text that may be interpreted or compiled differently than what appears below. To review, open the file in an editor that reveals hidden Unicode characters.
Learn more about bidirectional Unicode characters
| Original file line number | Diff line number | Diff line change |
|---|---|---|
| @@ -0,0 +1,15 @@ | ||
| --- | ||
| title: Node-Based View | ||
| --- | ||
|
|
||
| # Node-Based View | ||
|
|
||
| The node-based view shows the same trace as a visual flow. It helps you understand the overall path at a glance and see how agents, tools, memory, and model calls connect. | ||
|
|
||
| Use this view when you want the big picture, then drill into a specific node for details. | ||
|
|
||
| <video controls loop muted playsInline style={{width: '100%', height: 'auto'}}> | ||
|
|
||
| <source src="https://cdn.voltagent.dev/docs/observability/tracing/node-based.mp4" type="video/mp4" /> | ||
| Your browser does not support the video tag. | ||
| </video> |
This file contains hidden or bidirectional Unicode text that may be interpreted or compiled differently than what appears below. To review, open the file in an editor that reveals hidden Unicode characters.
Learn more about bidirectional Unicode characters
This file contains hidden or bidirectional Unicode text that may be interpreted or compiled differently than what appears below. To review, open the file in an editor that reveals hidden Unicode characters.
Learn more about bidirectional Unicode characters
| Original file line number | Diff line number | Diff line change |
|---|---|---|
| @@ -0,0 +1,50 @@ | ||
| --- | ||
| title: User Analytics | ||
| --- | ||
|
|
||
| # User Analytics | ||
|
|
||
| The Users page groups traces by user so you can see who is impacted and where issues concentrate. It helps you go from "something feels off" to a specific user, session, and trace. | ||
|
|
||
| <video controls loop muted playsInline style={{width: '100%', height: 'auto'}}> | ||
|
|
||
| <source src="https://cdn.voltagent.dev/docs/observability/tracing/tracing-users.mp4" type="video/mp4" /> | ||
| Your browser does not support the video tag. | ||
| </video> | ||
|
|
||
| <br/> | ||
| <br/> | ||
|
|
||
| ## Key Metrics | ||
|
|
||
| Quick read of volume, success rate, latency, and cost over time. Use it to decide if the problem is quality, performance, or spend, and to link regressions to model switches. | ||
|
|
||
| <img | ||
| src="https://cdn.voltagent.dev/docs/observability/tracing/tracing-charts.gif" | ||
| alt="Trace filters overview" | ||
| style={{ maxWidth: "100%", borderRadius: "12px", display: "block", margin: "0 auto" }} | ||
| /> | ||
|
|
||
| <br/> | ||
|
|
||
| ## User Feedback | ||
|
|
||
| Feedback turns user sentiment into signals you can track. Use it to confirm whether fixes improved the experience and to see which issues users feel most. | ||
|
|
||
| <img | ||
| src="https://cdn.voltagent.dev/docs/observability/tracing/tracing-feedback.gif" | ||
| alt="Trace filters overview" | ||
| style={{ maxWidth: "100%", borderRadius: "12px", display: "block", margin: "0 auto" }} | ||
| /> | ||
|
|
||
| <br/> | ||
|
|
||
| Use the charts to see feedback volume, sentiment trends, score clusters, dominant feedback keys, and when users leave comments. | ||
|
|
||
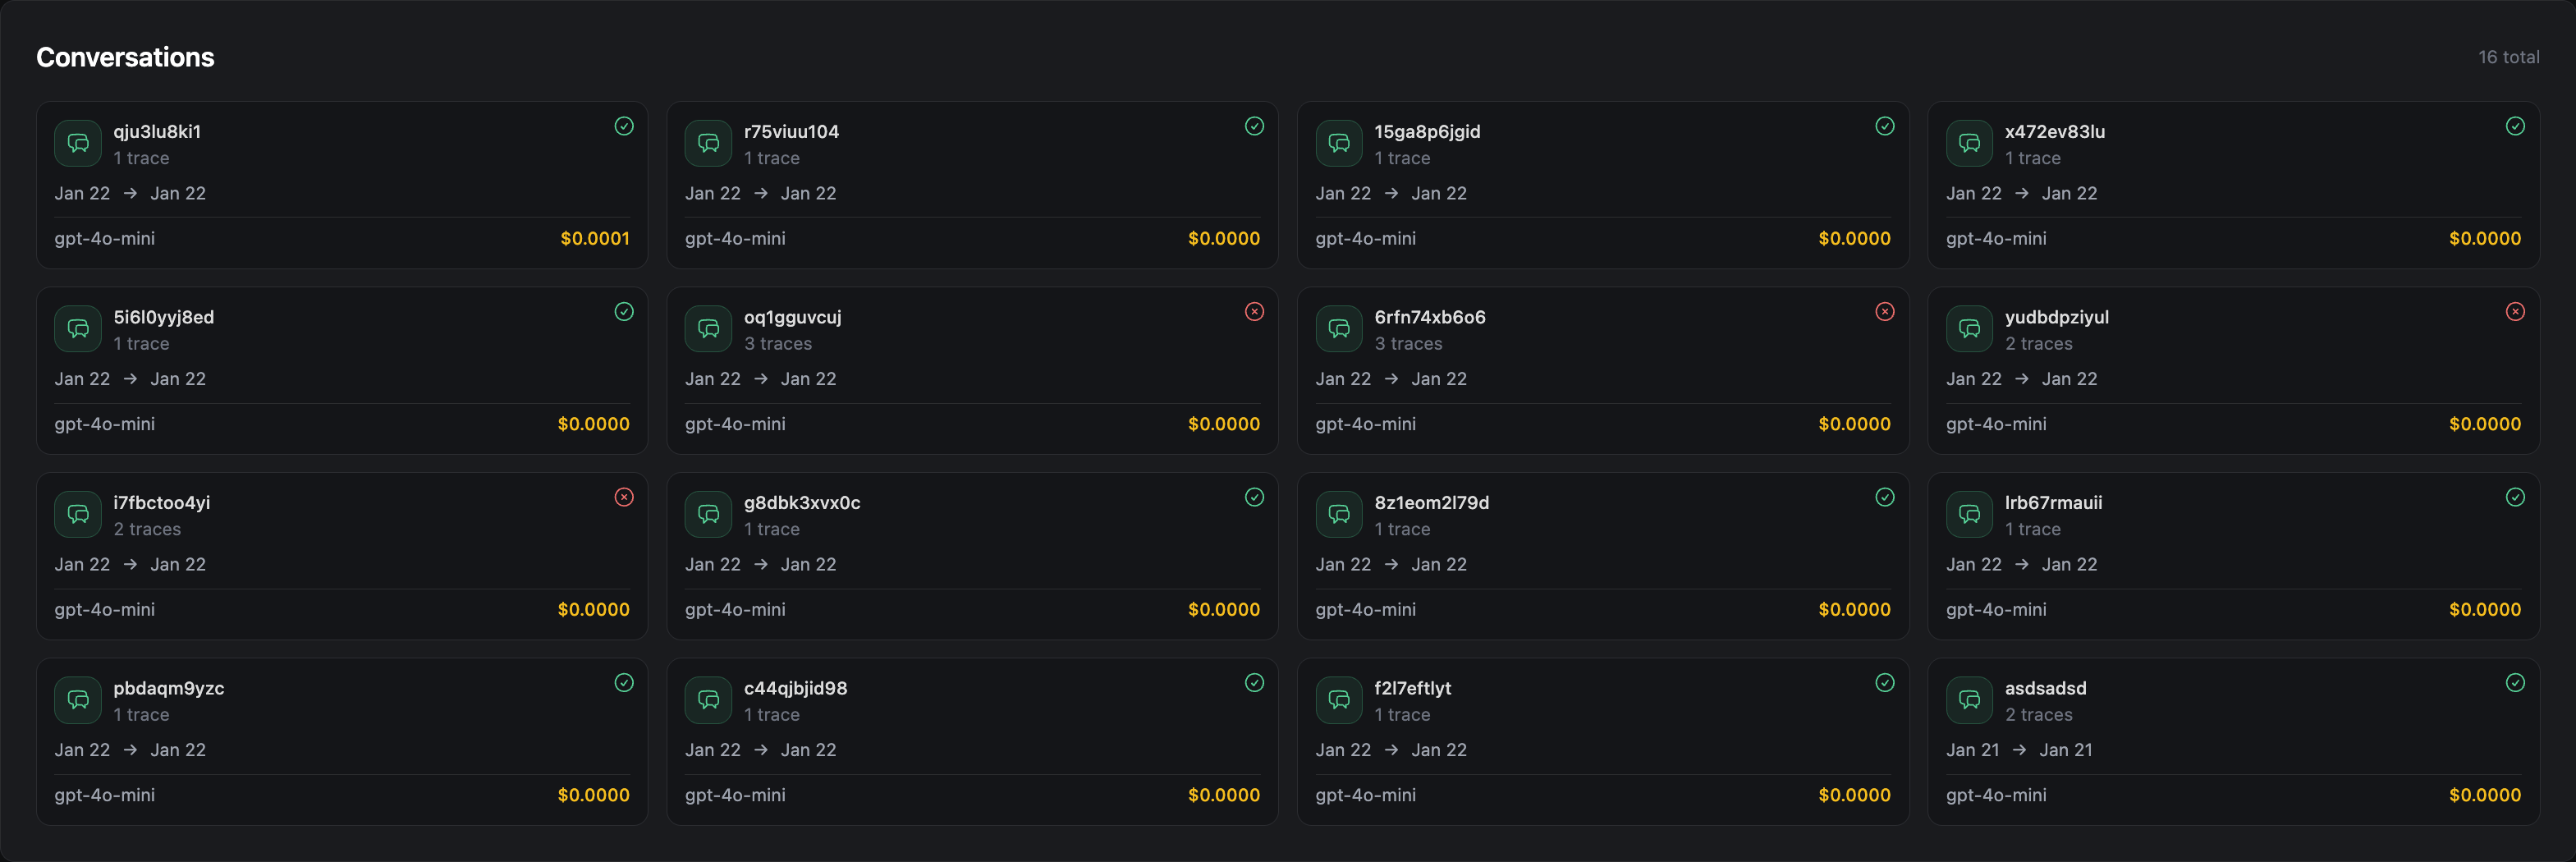
| ## Conversations | ||
|
|
||
| Conversations group traces by session so you can follow a user flow end to end. | ||
|
|
||
| Use the cards (status, time range, model, cost) to pick the most suspicious session, then filter traces to that path. | ||
|
|
||
|  | ||
This file contains hidden or bidirectional Unicode text that may be interpreted or compiled differently than what appears below. To review, open the file in an editor that reveals hidden Unicode characters.
Learn more about bidirectional Unicode characters
| Original file line number | Diff line number | Diff line change |
|---|---|---|
| @@ -0,0 +1,25 @@ | ||
| --- | ||
| title: Waterfall View | ||
| --- | ||
|
|
||
| # Waterfall View | ||
|
|
||
| Use Waterfall to understand timing and execution order. It shows spans as a hierarchy so you can see where time is spent, how retries fan out, and which step failed first. | ||
|
|
||
| <video controls loop muted playsInline style={{width: '100%', height: 'auto'}}> | ||
|
|
||
| <source src="https://cdn.voltagent.dev/docs/observability/tracing/waterfall.mp4" type="video/mp4" /> | ||
| Your browser does not support the video tag. | ||
| </video> | ||
|
|
||
| <br/> | ||
| <br/> | ||
|
|
||
| Use Waterfall when you need the root cause of a failure or a latency spike. The details panel gives the context you need to confirm tool usage, memory behavior, and LLM settings without digging through logs. | ||
|
|
||
| Key signals to check: | ||
|
|
||
| - **Failure path**: error badges + child spans to see the first break and its causes. | ||
| - **Latency hotspots**: duration bars and timing to find the slowest steps. | ||
| - **Model context**: input/output and UI vs model messages to verify prompts and responses. | ||
| - **Configuration**: LLM config, memory config, and knowledge base usage for this span. |
This file contains hidden or bidirectional Unicode text that may be interpreted or compiled differently than what appears below. To review, open the file in an editor that reveals hidden Unicode characters.
Learn more about bidirectional Unicode characters
This file contains hidden or bidirectional Unicode text that may be interpreted or compiled differently than what appears below. To review, open the file in an editor that reveals hidden Unicode characters.
Learn more about bidirectional Unicode characters
| Original file line number | Diff line number | Diff line change |
|---|---|---|
| @@ -0,0 +1,29 @@ | ||
| import React from "react"; | ||
|
|
||
| type MediaPanelProps = { | ||
| src: string; | ||
| alt: string; | ||
| width?: number | string; | ||
| }; | ||
|
|
||
| const MediaPanel = ({ src, alt, width = "100%" }: MediaPanelProps) => ( | ||
| <div className="my-6 w-full"> | ||
| <div | ||
| className="w-full rounded-2xl p-5" | ||
| style={{ | ||
| background: "linear-gradient(180deg, #15161a 0%, #0f1013 100%)", | ||
| border: "1px solid #2b2d2f", | ||
| boxShadow: "0 20px 40px rgba(0,0,0,0.35)", | ||
| }} | ||
| > | ||
| <img | ||
| src={src} | ||
| alt={alt} | ||
| style={{ width: typeof width === "number" ? `${width}px` : width }} | ||
| className="mx-auto block max-w-full rounded-xl" | ||
| /> | ||
| </div> | ||
| </div> | ||
| ); | ||
|
|
||
| export default MediaPanel; |
Add this suggestion to a batch that can be applied as a single commit.
This suggestion is invalid because no changes were made to the code.
Suggestions cannot be applied while the pull request is closed.
Suggestions cannot be applied while viewing a subset of changes.
Only one suggestion per line can be applied in a batch.
Add this suggestion to a batch that can be applied as a single commit.
Applying suggestions on deleted lines is not supported.
You must change the existing code in this line in order to create a valid suggestion.
Outdated suggestions cannot be applied.
This suggestion has been applied or marked resolved.
Suggestions cannot be applied from pending reviews.
Suggestions cannot be applied on multi-line comments.
Suggestions cannot be applied while the pull request is queued to merge.
Suggestion cannot be applied right now. Please check back later.
Uh oh!
There was an error while loading. Please reload this page.