Support monitoring AWS Cloud EKS#10199
Conversation


 wu-sheng
added
metrics
wu-sheng
added
metrics


| - name: net_tx_dropped | ||
| exp: node_network_tx_dropped.downsampling(SUM) | ||
| - name: net_tx_error | ||
| exp: node_network_tx_errors.downsampling(SUM) |

There was a problem hiding this comment.
Can you confirm why these metrics use downsampling(SUM), I can see these units are Count/Second from the
origin OTEL metrics. SUM would plus the value of the metrics each time, should use the default downsampling
AVG?
There was a problem hiding this comment.
please ignore the approval for now... It's a mistake.
There was a problem hiding this comment.
Sum may be not correct, especially at high dimensiona(hour/day)
There was a problem hiding this comment.
@pg-yang Could you check here? Network TX Error Count (per second) is the description, why it could be downsampling(SUM)?
There was a problem hiding this comment.
Yep, I will confirm these issues by the end of this week at the latest.
There was a problem hiding this comment.
I couldn't find any documentation that describes the calculation, but I found the source code.
In a word, the calculation logic is (preValue-currentValue) / (preTimeInSecond-currentTimeInSecond).
- value (
preValueorcurrentValue) is cumulative count of transmit errors encountered. It's defined in https://github.com/google/cadvisor/blob/master/info/v1/container.go#L434 currentValue,currentTimeInSecondwill be stored to cache aspreValue,preTimeInSecondfor the next calculation
I put the source code here:
- Calculate method: https://github.com/open-telemetry/opentelemetry-collector-contrib/blob/951245d4273845de59db3b00f5445bcad9ce4372/internal/aws/metrics/metric_calculator.go#L67
- The
calculateFuncmethod that is called byCalculate method: https://github.com/open-telemetry/opentelemetry-collector-contrib/blob/951245d4273845de59db3b00f5445bcad9ce4372/receiver/awscontainerinsightreceiver/internal/cadvisor/extractors/extractor.go#L127
BTW
  - name: net_tx_error
    exp: node_network_tx_errors.downsampling(SUM)
The above metric is organized from node level to cluster level,so I think latest should be inappropriate.Also,if we use avg, the meaning will be net errors per second, per node.
There was a problem hiding this comment.
From your description, I would say avg makes more sense.
Sum for day and hour dimension would be a disaster, right?
We have to keep per node, I am afraid, there is no way we could sum first and then avg, because from data process perspective, there is no difference between two node and two period report of one node, right?


 wu-sheng
left a comment
wu-sheng
left a comment
wu-sheng
left a comment
There was a problem hiding this comment.
LGTM. Pending on more confirmations from @kezhenxu94 @wankai123
|
|
||
| ### AWS Container Insights Receiver Deploy Example | ||
|
|
||
| ```yaml |

There was a problem hiding this comment.
This sample yaml is way too long that it doesn't highlight the important part, please remove unrelated content and replace with their official documentation link, an example would be
# ... other resources definitions
# OTEL configuration that specify OAP address("oap-service:11800") as otlp exporter address
apiVersion: v1
kind: ConfigMap
metadata:
  name: otel-agent-conf
  namespace: aws-otel-eks
  labels:
    app: opentelemetry
    component: otel-agent-conf
data:
  otel-agent-config: |
    # ...
    receivers:
      awscontainerinsightreceiver:

    # Make sure to add a job-name attribute
    processors:
      resource/job-name:
        attributes:
        - key: job_name
          value: aws-cloud-eks-monitoring
          action: insert

    exporters:
      otlp:
        endpoint: oap-service:11800
        tls:
          insecure: true
      logging:
          loglevel: debug

    service:
      pipelines:
        metrics:
          receivers: [awscontainerinsightreceiver]
          processors: [resource/job-name]
          exporters: [otlp,logging]

# ... other resourcesThere was a problem hiding this comment.
If you want to give a complete sample, let's create a dedicated yaml file and link to that file, so users can simply use kubectl apply -f sample.yaml to set up the sample, without having to copy the large chunk of content.
There was a problem hiding this comment.
I think a complete OTEL YAML file would be good to host in the doc. Or we could link the file to the incoming file in the showcase.
There was a problem hiding this comment.
I think a complete OTEL YAML file would be good to host in the doc
Agree with it, we don't have showcase for now.
There was a problem hiding this comment.
@pg-yang Are you going to move this to a separate file?
There was a problem hiding this comment.
I only provide a OTEL configuration sample in the doc

|
@pg-yang Let's fix the left issues and merge this :) |
4 participants


CHANGESlog.Related issue #9883
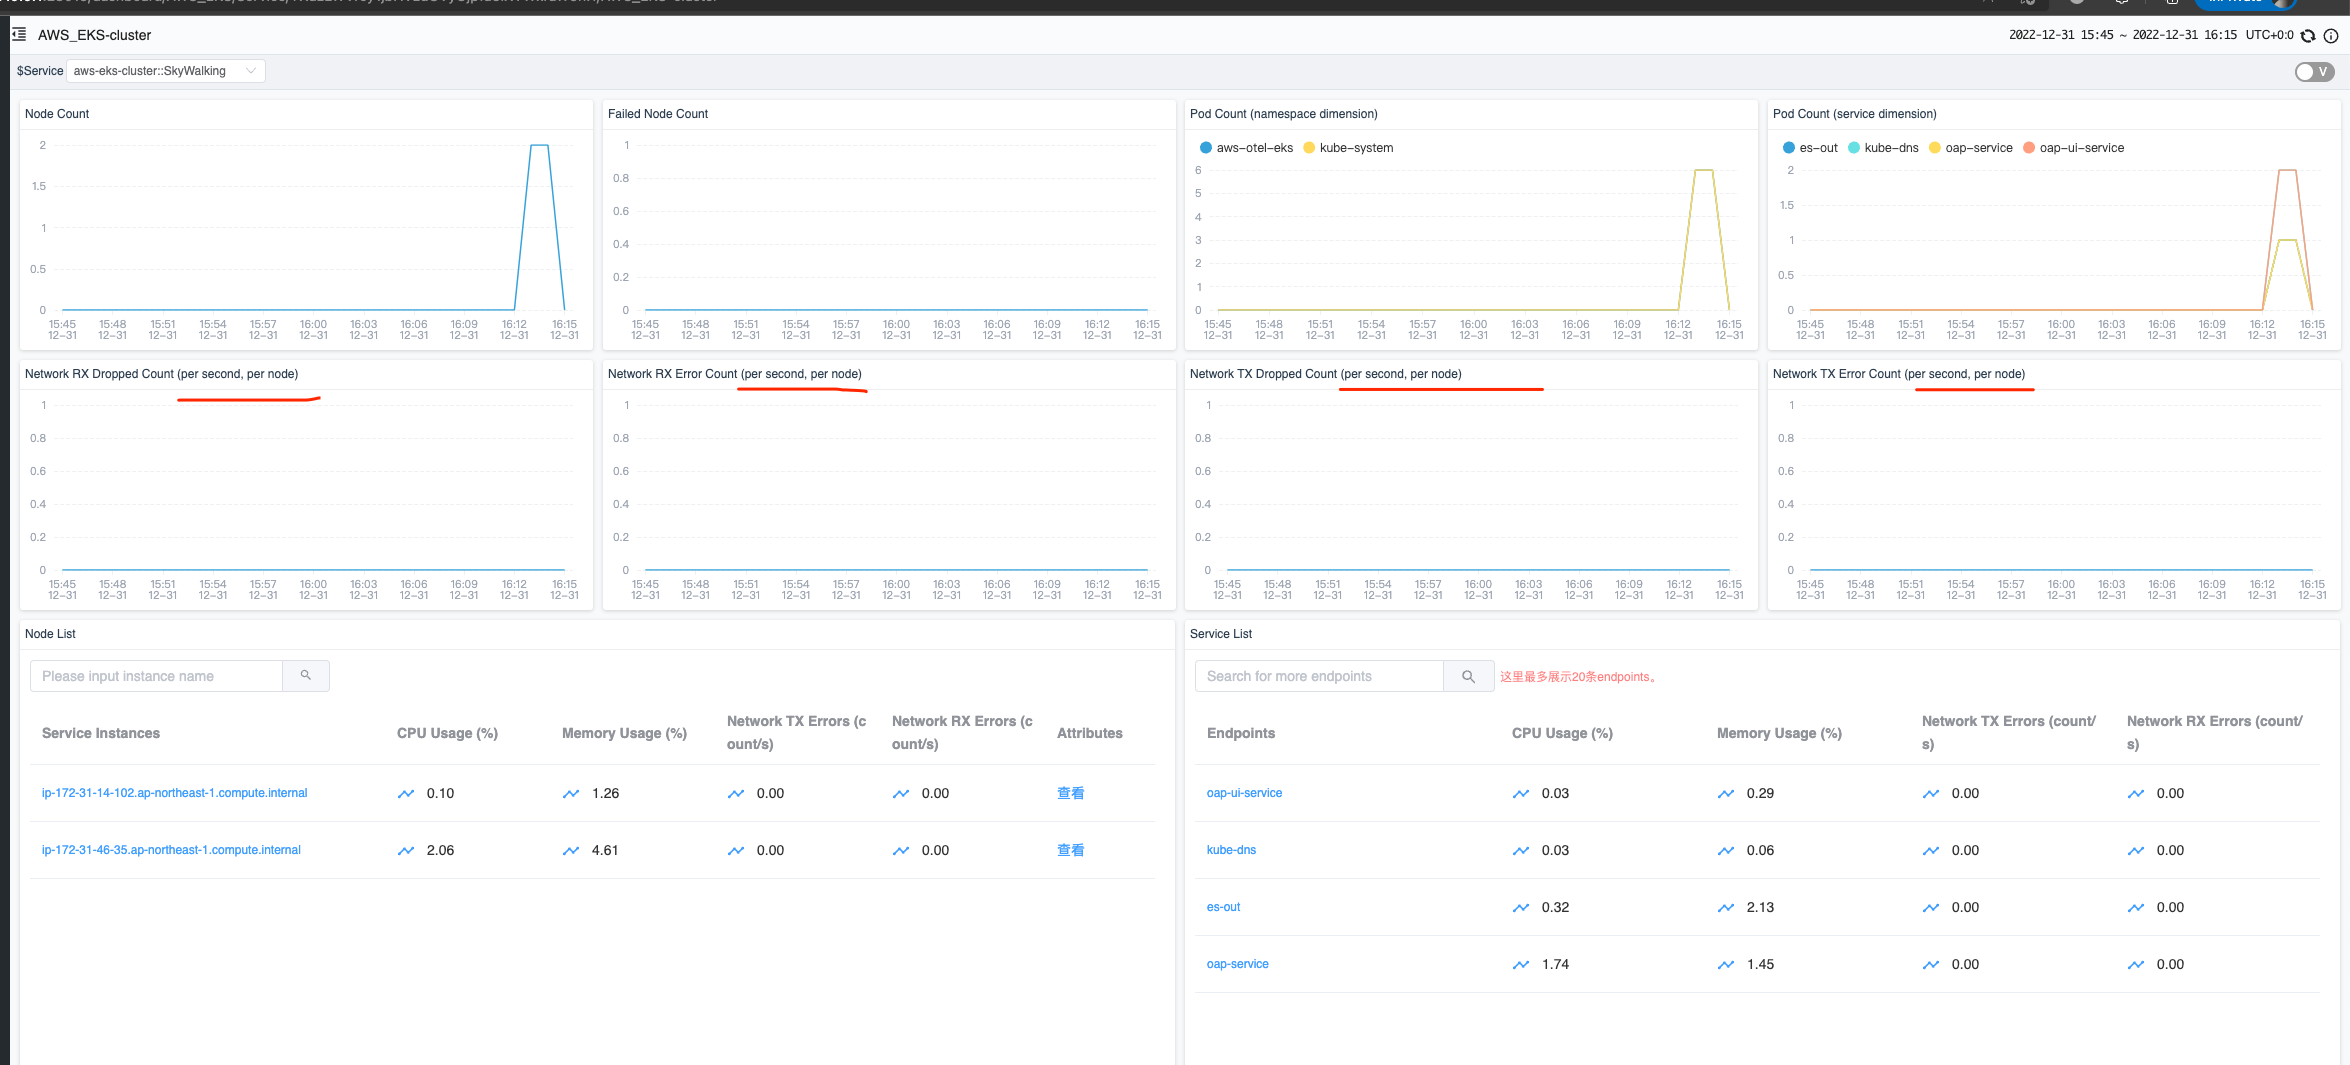
java-test-servicefor mocking EKS e2e testUI screenshot
Node metrics
Service metrics