![]() ##VitalSigns-water
[project] water gauging and drainage map + line graph
##VitalSigns-water
[project] water gauging and drainage map + line graph
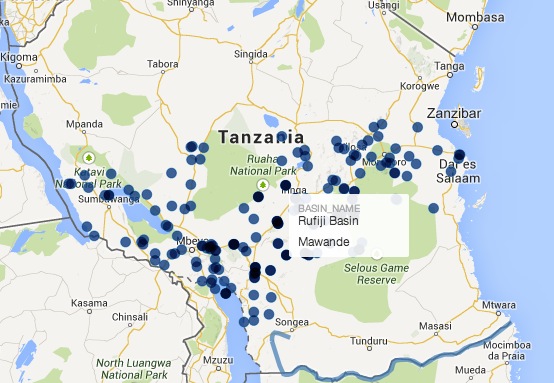
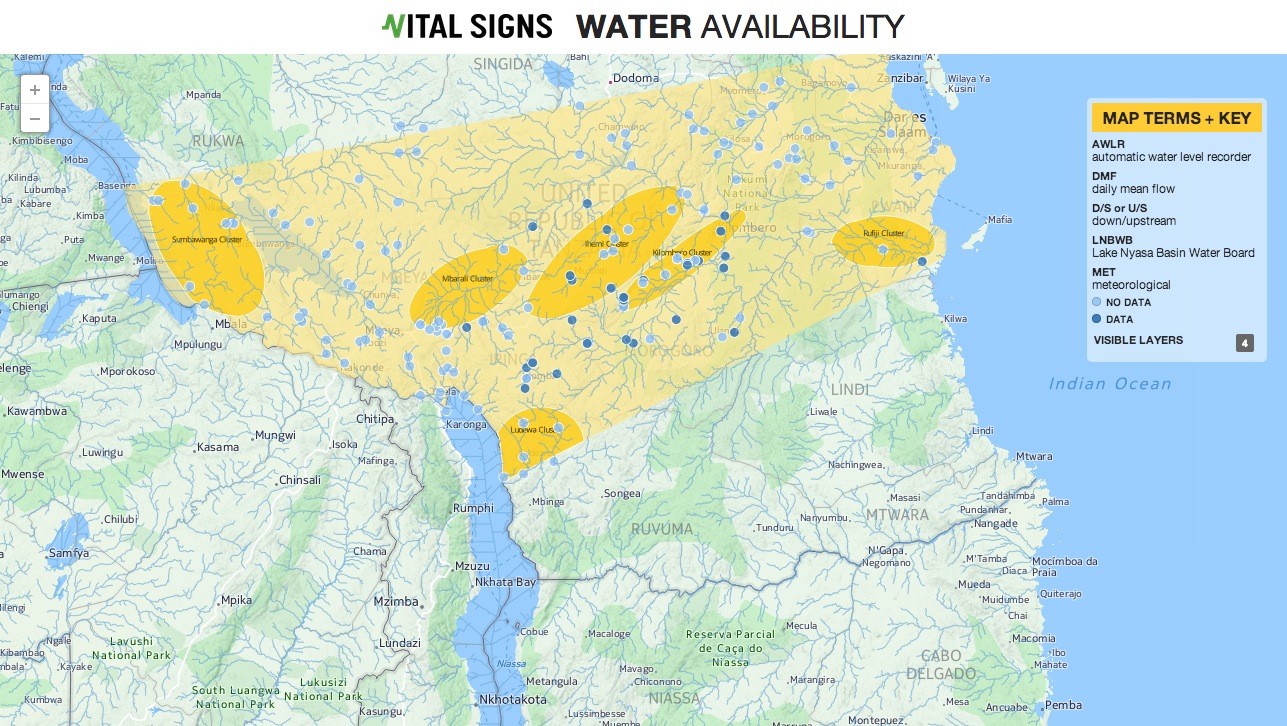
Originally piloted with only water gauging stations and rivers rendered, this map looked like this:
-
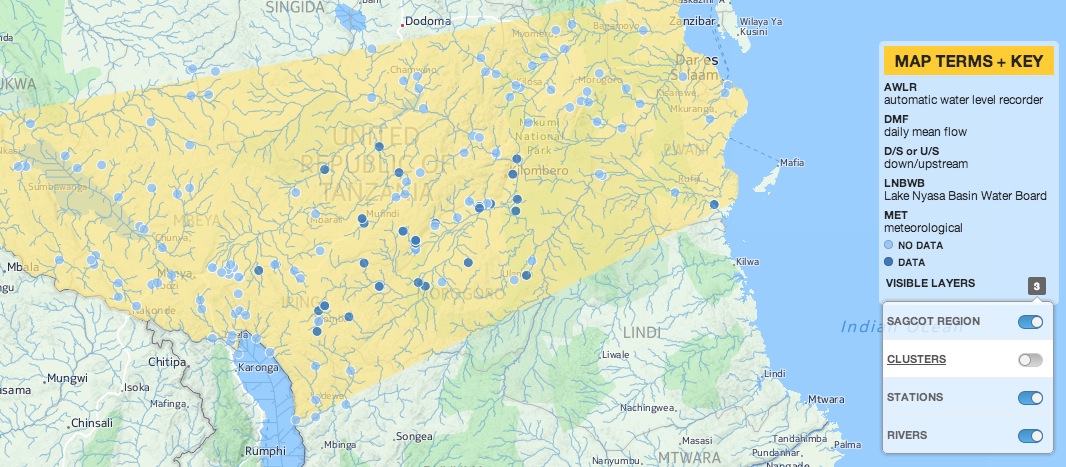
The current map illustrates water gauging stations locations on a map of TZA, and renders data collected from those stations on selecting the station.
-
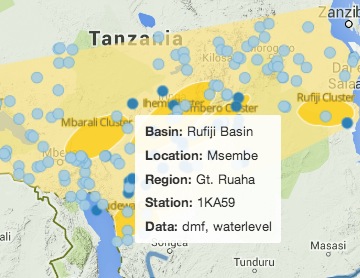
The tooltips on the map give information about the gauging stations, and the data types associated with them.
-
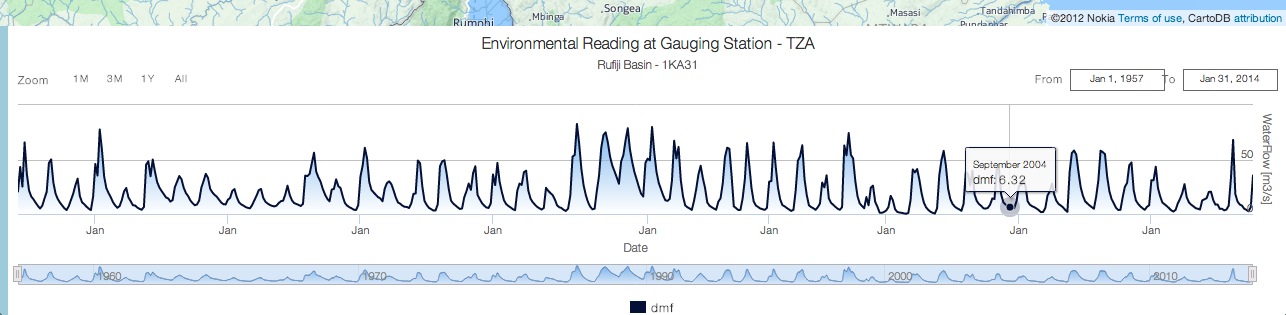
When clicked, the station points plotted on the map load associate data in the graph below.
-
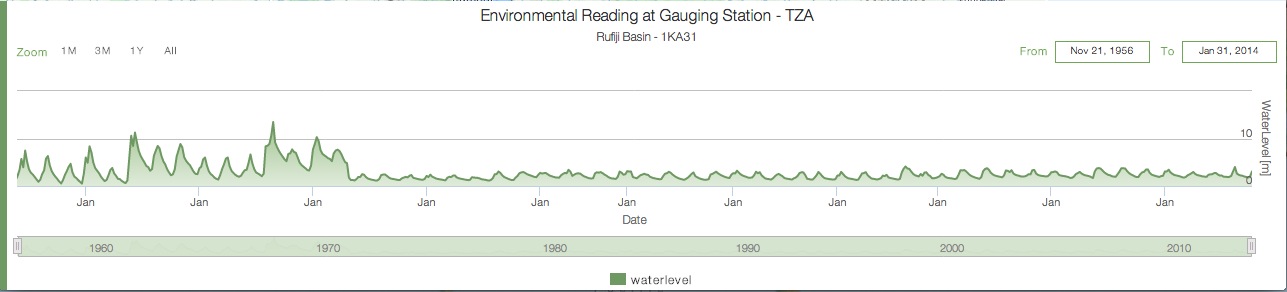
Stations will multiple data sets feature multiple graphs which can be scrolled through at right:
- A key at right defines common abbreviations, the map station color-scheme, and allows a user to show and hide map layers including the river network.
The data should be scrubbed to better match associated environmental data sets, and more data sets should be added such that the left hand menu works for all stations and loads temp, rainfall, waterlevel and dmf data. Those stations who currently have multiple data files associated with them are indicated in the tooltips.
You can find the work in progress demo here.
Current Feature Status Document (available here)