**[See Observatory -> DevTools Tracking Issue](https://github.com/flutter/devtools/issues/3858).** Performance tooling functionality from Observatory that’s not present in DevTools: - [x] Changing between code/function CPU profiles ([PR](https://github.com/flutter/devtools/pull/4622)) - [x] Call tree filtering - [x] Tag ordering (VM, User, None) ([PR](https://github.com/flutter/devtools/pull/4693)) - [ ] Last refresh time - [x] profiler stats (@kenzieschmoll) - [x] Go-to source from tree entry - [x] Method table view (tracked at https://github.com/flutter/devtools/issues/841) (@kenzieschmoll) - [x] closure display is incomplete (https://github.com/flutter/devtools/issues/5354) **Observatory CPU Profile View** 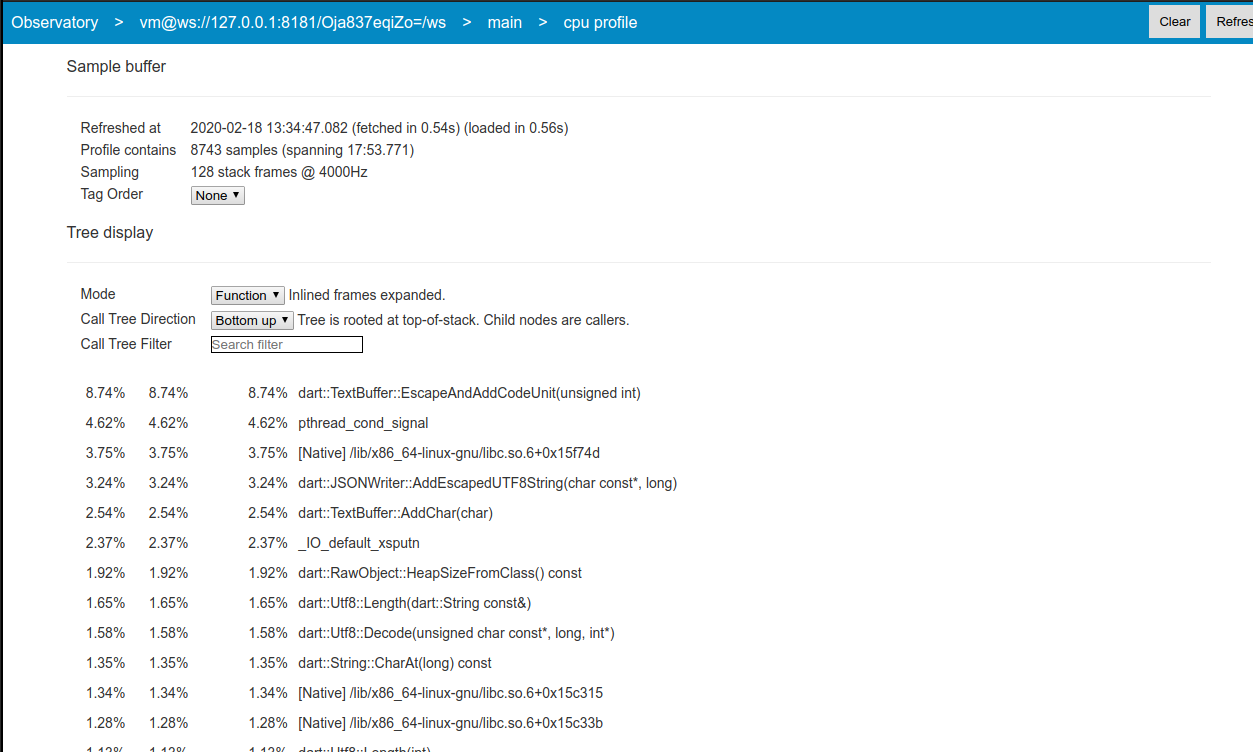 **Observatory CPU Profile Method Table View** 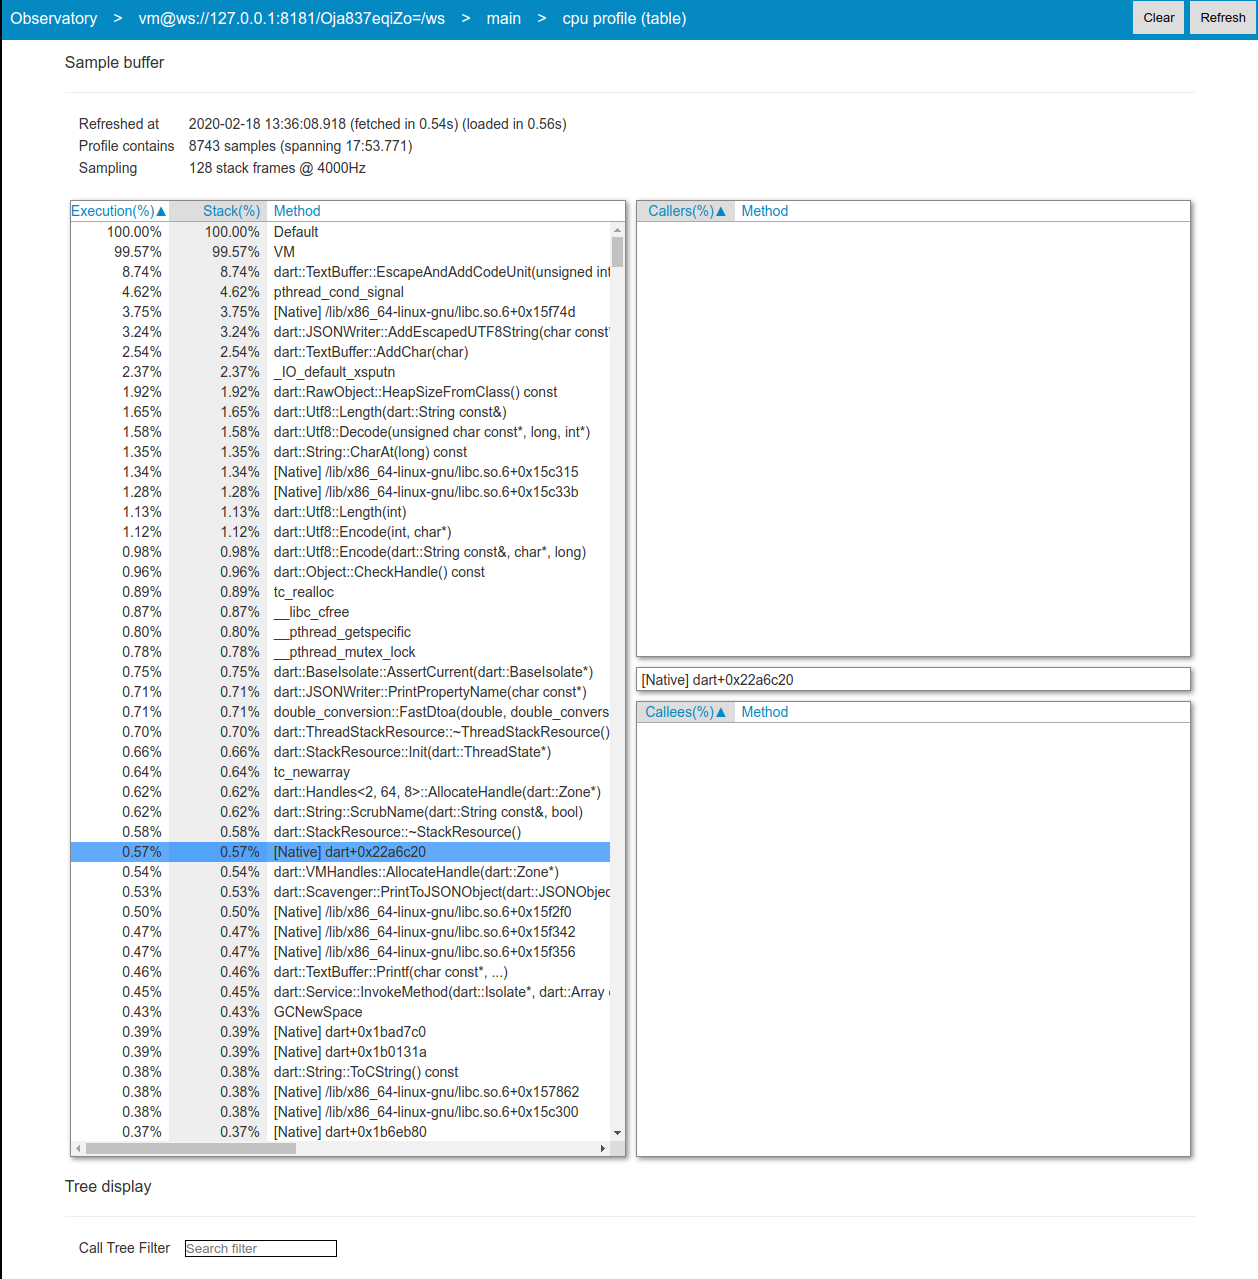

See Observatory -> DevTools Tracking Issue.
Performance tooling functionality from Observatory that’s not present in DevTools:
Observatory CPU Profile View
Observatory CPU Profile Method Table View