This repository was archived by the owner on Aug 29, 2025. It is now read-only.
app_sizing width examples in Dash Table #121
There are no files selected for viewing
This file contains hidden or bidirectional Unicode text that may be interpreted or compiled differently than what appears below. To review, open the file in an editor that reveals hidden Unicode characters.
Learn more about bidirectional Unicode characters
| Original file line number | Diff line number | Diff line change |
|---|---|---|
|
|
@@ -43,6 +43,13 @@ def layout(): | |
| df_long = pd.DataFrame( | ||
| OrderedDict([(name, col_data * 10) for (name, col_data) in data.items()]) | ||
| ) | ||
| df_two_columns = pd.DataFrame({"Column 1": [1, 2], "Column 2": [3, 3]}) | ||
| df_long_columns = pd.DataFrame( | ||
| { | ||
| "Column {}".format(i): [1, 2] | ||
| for i in range(10) | ||
| } | ||
| ) | ||
|
|
||
| return [ | ||
| html.H1("Sizing Guide"), | ||
|
|
@@ -51,6 +58,7 @@ def layout(): | |
| "marginLeft": "auto", | ||
| "marginRight": "auto", | ||
| "width": "80%", | ||
| "padding": "24px", | ||
| "borderLeft": "thin hotpink solid", | ||
| "borderRight": "thin hotpink solid", | ||
| }, | ||
|
|
@@ -77,6 +85,37 @@ def layout(): | |
| """ | ||
| ), | ||
| html_table(df, table_style={"width": "100%"}, base_column_style={}), | ||
| section_title("HTML Table - All Column Widths defined by Percent"), | ||
| html.Div( | ||
| """ | ||
| The column widths can be definied by percents rather than pixels. | ||
| """ | ||
| ), | ||
| html_table( | ||
| df, | ||
| table_style={"width": "100%"}, | ||
| column_style={ | ||
| "Date": {"width": '30%'}, | ||
| "Election Polling Organization": {"width": '25%'}, | ||
| "Dem": {"width": '5%'}, | ||
| "Rep": {"width": '5%'}, | ||
| "Ind": {"width": '5%'}, | ||
| "Region": {"width": '30%'}, | ||
| }, | ||
| ), | ||
| section_title("HTML Table - Single Column Width Defined by Percent"), | ||
| html.Div( | ||
| """ | ||
| The width of one column (Region=50%) can be definied by percent. | ||
| """ | ||
| ), | ||
| html_table( | ||
| df, | ||
| table_style={"width": "100%"}, | ||
| column_style={ | ||
| "Region": {"width": '50%'}, | ||
| }, | ||
| ), | ||
| section_title("HTML Table - Columns with min-width"), | ||
| html.Div( | ||
| "Here, the min-width for the first column is 130px, or about the width of this line: " | ||
|
|
@@ -249,24 +288,157 @@ def layout(): | |
| columns=[{"name": i, "id": i} for i in df.columns], | ||
| ), | ||
| section_title("Dash Table - Padding"), | ||
| dash_table.Table( | ||
| id="dt-padding", | ||
| dataframe=df.to_dict("rows"), | ||
| columns=[{"name": i, "id": i} for i in df.columns], | ||
| table_style=[{ | ||
| 'selector': '.dash-cell', | ||
| 'rule': 'padding-left: 10px;' | ||
| }] | ||
| ), | ||
| section_title("Dash Table - All Column Widths by Percent [Not working?]"), | ||
| dash_table.Table( | ||
| id="dt-widths-all-percentage", | ||
| dataframe=df.to_dict("rows"), | ||
| columns=[{"name": i, "id": i} for i in df.columns], | ||
| column_static_style=[ | ||
| { | ||
| 'id': 'Date', | ||
| 'style': {'width': '30%'} | ||
| }, | ||
| { | ||
| 'id': 'Election Polling Organization', | ||
| 'style': {'width': '25%'} | ||
| }, | ||
| { | ||
| 'id': 'Dem', | ||
| 'style': {'width': '5%'} | ||
| }, | ||
| { | ||
| 'id': 'Rep', | ||
| 'style': {'width': '5%'} | ||
| }, | ||
| { | ||
| 'id': 'Ind', | ||
| 'style': {'width': '5%'} | ||
| }, | ||
| { | ||
| 'id': 'Region', | ||
| 'style': {'width': '30%'} | ||
| } | ||
| ] | ||
| ), | ||
| section_title("Dash Table - Single Column Width by Percent [Not working?]"), | ||
| dash_table.Table( | ||
| id="dt-widths-one-percentage", | ||
| dataframe=df.to_dict("rows"), | ||
| columns=[{"name": i, "id": i} for i in df.columns], | ||
| table_style=[{ | ||
| 'selector': '.dash-spreadsheet', | ||
| 'rule': 'width: 100%;' | ||
| }], | ||
| column_static_style=[ | ||
| { | ||
| 'id': 'Region', | ||
| 'style': {'width': '50%'} | ||
| } | ||
| ] | ||
| ), | ||
| section_title("Dash Table - Underspecified Widths"), | ||
| dash_table.Table( | ||
| id="dt-underspec", | ||
| dataframe=df.to_dict("rows"), | ||
| columns=[{"name": i, "id": i, "width": 50, "maxWidth": 300} for i in df.columns], | ||
| ), | ||
| section_title("Dash Table - Widths that are smaller than the content [Not Working]"), | ||
| dash_table.Table( | ||
| id="dt-small-widths", | ||
| dataframe=df.to_dict("rows"), | ||
| columns=[{"name": i, "id": i, "width": 10} for i in df.columns], | ||
| ), | ||
| # ... | ||
| section_title("Dash Table - Content with Ellipses [Not Working]"), | ||
|
Member
There was a problem hiding this comment. @Marc-Andre-Rivet can you review all of these "[Not Working]" examples? |
||
| # ... | ||
| dash_table.Table( | ||
| id="dt-ellipsis", | ||
| dataframe=df.to_dict("rows"), | ||
| columns=[{"name": i, "id": i, "maxWidth": 10} for i in df.columns], | ||
| table_style=[{ | ||
| 'selector': '.dash-cell', | ||
| 'rule': 'padding-left: 10px; white-space: nowrap; overflow: hidden; text-overflow: ellipsis;' | ||
| }] | ||
| ), | ||
| section_title("Dash Table - Vertical Scrolling"), | ||
| dash_table.Table( | ||
| id="dt-vert-scroll", | ||
| dataframe=df_long.to_dict("rows"), | ||
| columns=[{"name": i, "id": i} for i in df_long.columns], | ||
| table_style=[{ | ||
| 'selector': '.dash-spreadsheet', | ||
| 'rule': 'max-height: 300px; overflow: scroll;' | ||
| }] | ||
| ), | ||
| # ... | ||
| section_title("Dash Table - Vertical Scrolling with Max Height"), | ||
| dash_table.Table( | ||
| id="dt-vert-scroll-max-height", | ||
| dataframe=df.to_dict("rows"), | ||
| columns=[{"name": i, "id": i} for i in df.columns], | ||
| table_style=[{ | ||
| 'selector': '.dash-spreadsheet', | ||
| 'rule': 'max-height: 300px; overflow: scroll;' | ||
| }] | ||
| ), | ||
|
Member
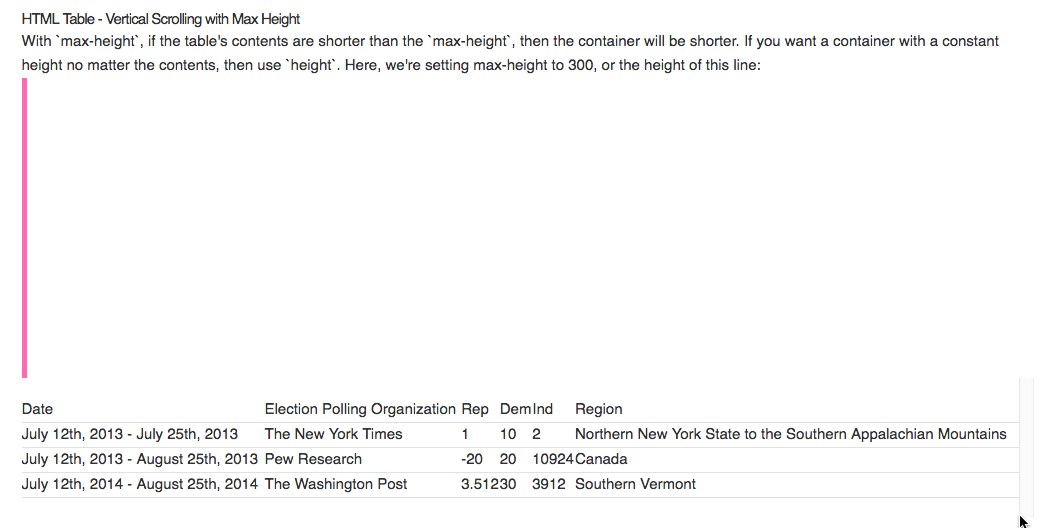
There was a problem hiding this comment. The purpose of this example was to show that the table container wouldn't expand past its max height. In the HTML example, it was demonstrated by using 3 rows of data but setting the max height to something much larger: So, could we update this example to use |
||
| # ... | ||
| section_title("Dash Table - Vertical Scrolling with Height"), | ||
| dash_table.Table( | ||
| id="dt-vert-scroll", | ||
| dataframe=df.to_dict("rows"), | ||
| columns=[{"name": i, "id": i} for i in df.columns], | ||
| table_style=[{ | ||
| 'selector': '.dash-spreadsheet', | ||
| 'rule': 'height: 300px; overflow: scroll;' | ||
| }] | ||
| ), | ||
|
Member
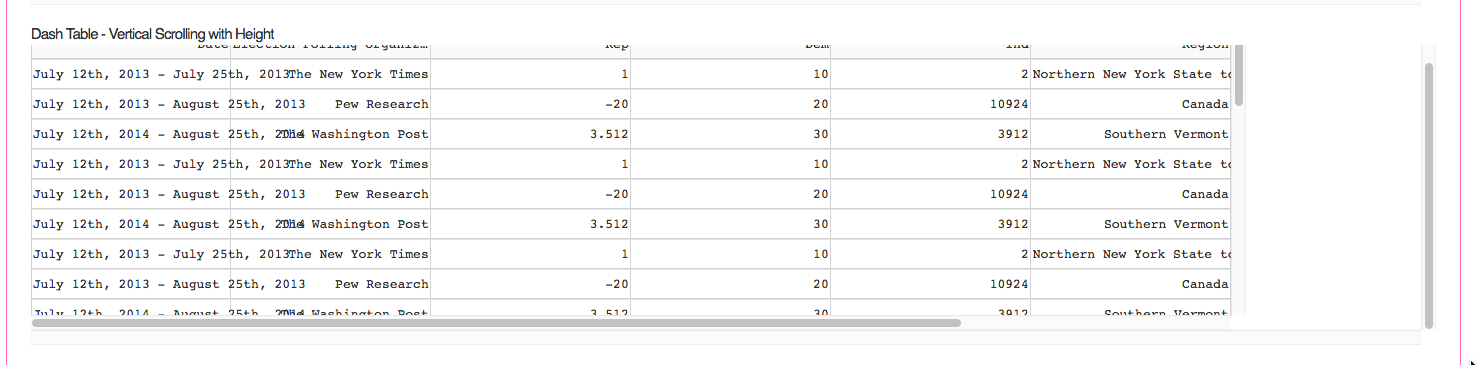
There was a problem hiding this comment. I'm seeing a double scroll bar here: |
||
| section_title("Dash Table - Horizontal Scrolling"), | ||
| section_title("Dash Table - Two Columns, 100% Min-Width"), | ||
| dash_table.Table( | ||
| id="dt-hor-scroll", | ||
| dataframe=df_two_columns.to_dict("rows"), | ||
| columns=[{"name": i, "id": i} for i in df_two_columns.columns], | ||
| table_style=[{ | ||
| 'selector': '.dash-spreadsheet', | ||
| 'rule': 'min-width:100%; overflow-x: scroll;' | ||
| }, | ||
| { | ||
| 'selector': '.dash-spreadsheet table', | ||
| 'rule':'min-width: 100%;' | ||
| }, | ||
| { | ||
| 'selector':'.dash-cell', | ||
| 'rule': 'whitespace: nowrap;' | ||
| }] | ||
| ), | ||
| # ... | ||
| section_title("Dash Table - Long Columns, 100% Min-Width"), | ||
| dash_table.Table( | ||
| id="dt-hor-scroll", | ||
| dataframe=df_long_columns.to_dict("rows"), | ||
| columns=[{"name": i, "id": i} for i in df_long_columns.columns], | ||
| table_style=[{ | ||
| 'selector': '.dash-spreadsheet', | ||
| 'rule': 'min-width:100%; overflow-x: scroll;' | ||
| }, | ||
| { | ||
| 'selector': '.dash-spreadsheet table', | ||
| 'rule':'min-width: 100%;' | ||
| }, | ||
| { | ||
| 'selector':'.dash-cell', | ||
| 'rule': 'whitespace: nowrap;' | ||
| }] | ||
| ), | ||
| # ... | ||
| section_title("Dash Table - Alignment"), | ||
| # ... | ||
|
|
||

Add this suggestion to a batch that can be applied as a single commit.
This suggestion is invalid because no changes were made to the code.
Suggestions cannot be applied while the pull request is closed.
Suggestions cannot be applied while viewing a subset of changes.
Only one suggestion per line can be applied in a batch.
Add this suggestion to a batch that can be applied as a single commit.
Applying suggestions on deleted lines is not supported.
You must change the existing code in this line in order to create a valid suggestion.
Outdated suggestions cannot be applied.
This suggestion has been applied or marked resolved.
Suggestions cannot be applied from pending reviews.
Suggestions cannot be applied on multi-line comments.
Suggestions cannot be applied while the pull request is queued to merge.
Suggestion cannot be applied right now. Please check back later.
There was a problem hiding this comment.
Choose a reason for hiding this comment
The reason will be displayed to describe this comment to others. Learn more.
In the default HTML style, the cells expand to their content:

In the

dash-table, we have fixed width columns. Could we add an example where the cell's width expands to the content? We might want to make that the default. Here's how it looks now:There was a problem hiding this comment.
Choose a reason for hiding this comment
The reason will be displayed to describe this comment to others. Learn more.
That would be problematic with fixed rows.. as it stands right now
There was a problem hiding this comment.
Choose a reason for hiding this comment
The reason will be displayed to describe this comment to others. Learn more.
As I've mentioned before, I want us consider the case where we don't have fixed rows right now. I'm OK with fixed rows vs not fixed rows having different limitations.
There was a problem hiding this comment.
Choose a reason for hiding this comment
The reason will be displayed to describe this comment to others. Learn more.
#130 will provide support for default cell width