wrong grid cell is selected when clicking or hovering in the plot #6
Description
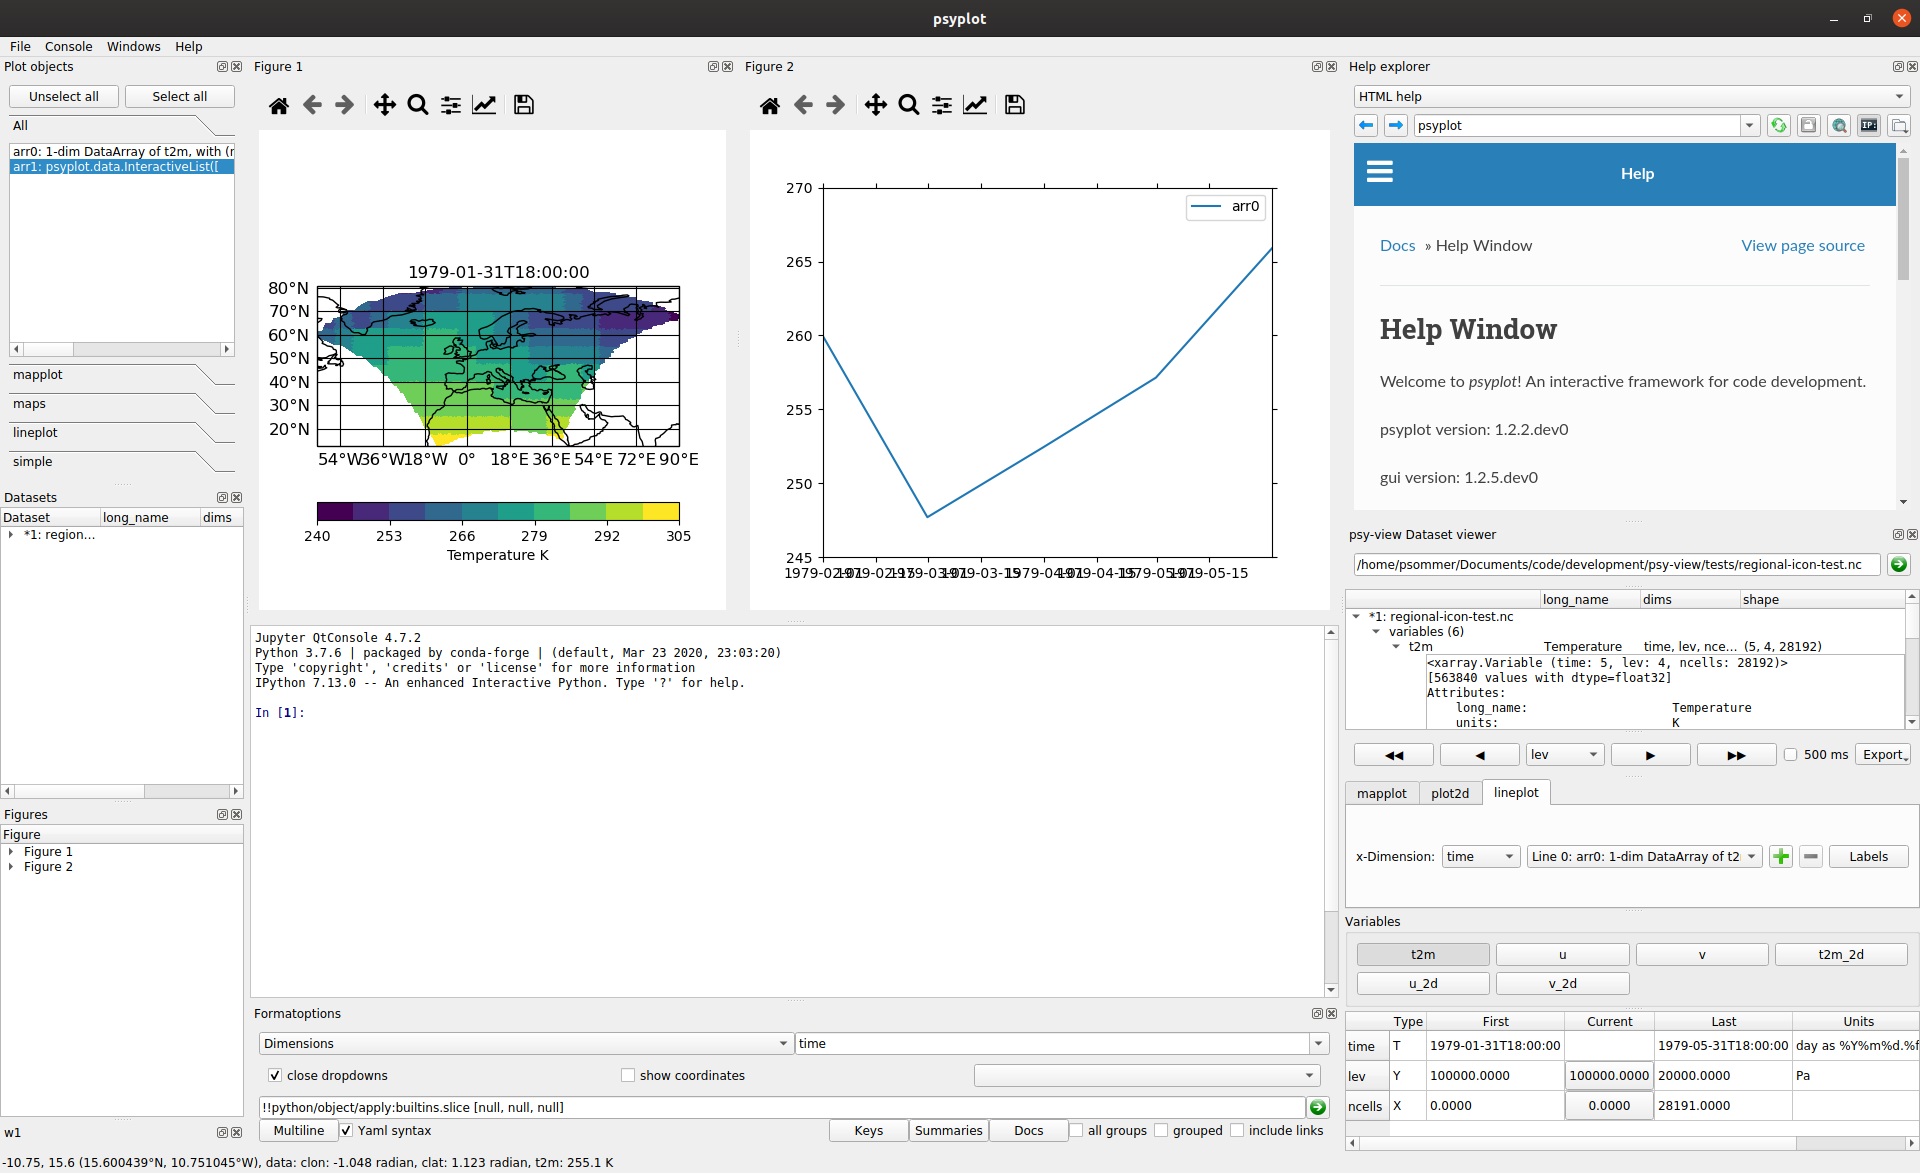
In the screenshot below, I clicked on the lower left corner of the plotted area and it created the lineplot on the left (which is clearly too cold). The data shown in the statusbar is wrong, too.