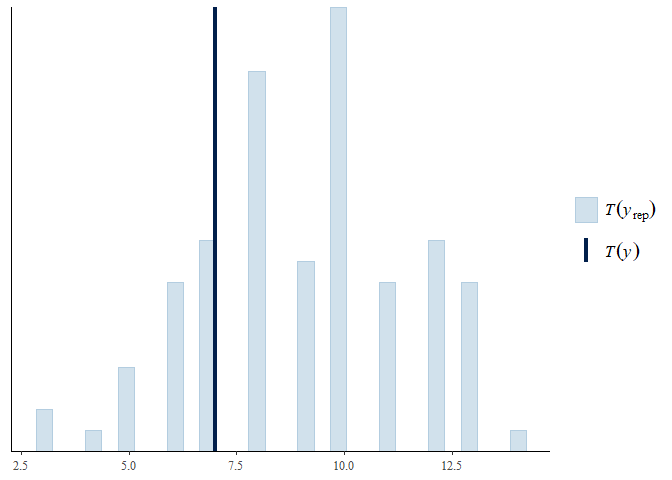
It seems that ppc_stat always assumes that the test statistic defined by stat is continuous, and thus draws a histogram, which is fine but sometimes looks quite ugly, for example:
set.seed(0)
y <- rbinom(20, 1, 0.2)
yrep <- matrix(rbinom(2000, 1, prob = 0.4), 1000, 20, byrow = TRUE)
bayesplot::ppc_stat(y, yrep, function(x) sum(abs(diff(x))))
#> `stat_bin()` using `bins = 30`. Pick better value with `binwidth`.
Created on 2024-10-14 with reprex v2.1.1
Is there an option (or another function) to specify that the test statistic is discrete, so that ppc_stat would produce a barplot instead?
It seems that
ppc_statalways assumes that the test statistic defined bystatis continuous, and thus draws a histogram, which is fine but sometimes looks quite ugly, for example:Created on 2024-10-14 with reprex v2.1.1
Is there an option (or another function) to specify that the test statistic is discrete, so that
ppc_statwould produce a barplot instead?